Ute vs Jamaican Vision Disability
COMPARE
Ute
Jamaican
Vision Disability
Vision Disability Comparison
Ute
Jamaicans
2.4%
VISION DISABILITY
0.1/ 100
METRIC RATING
267th/ 347
METRIC RANK
2.4%
VISION DISABILITY
0.1/ 100
METRIC RATING
262nd/ 347
METRIC RANK
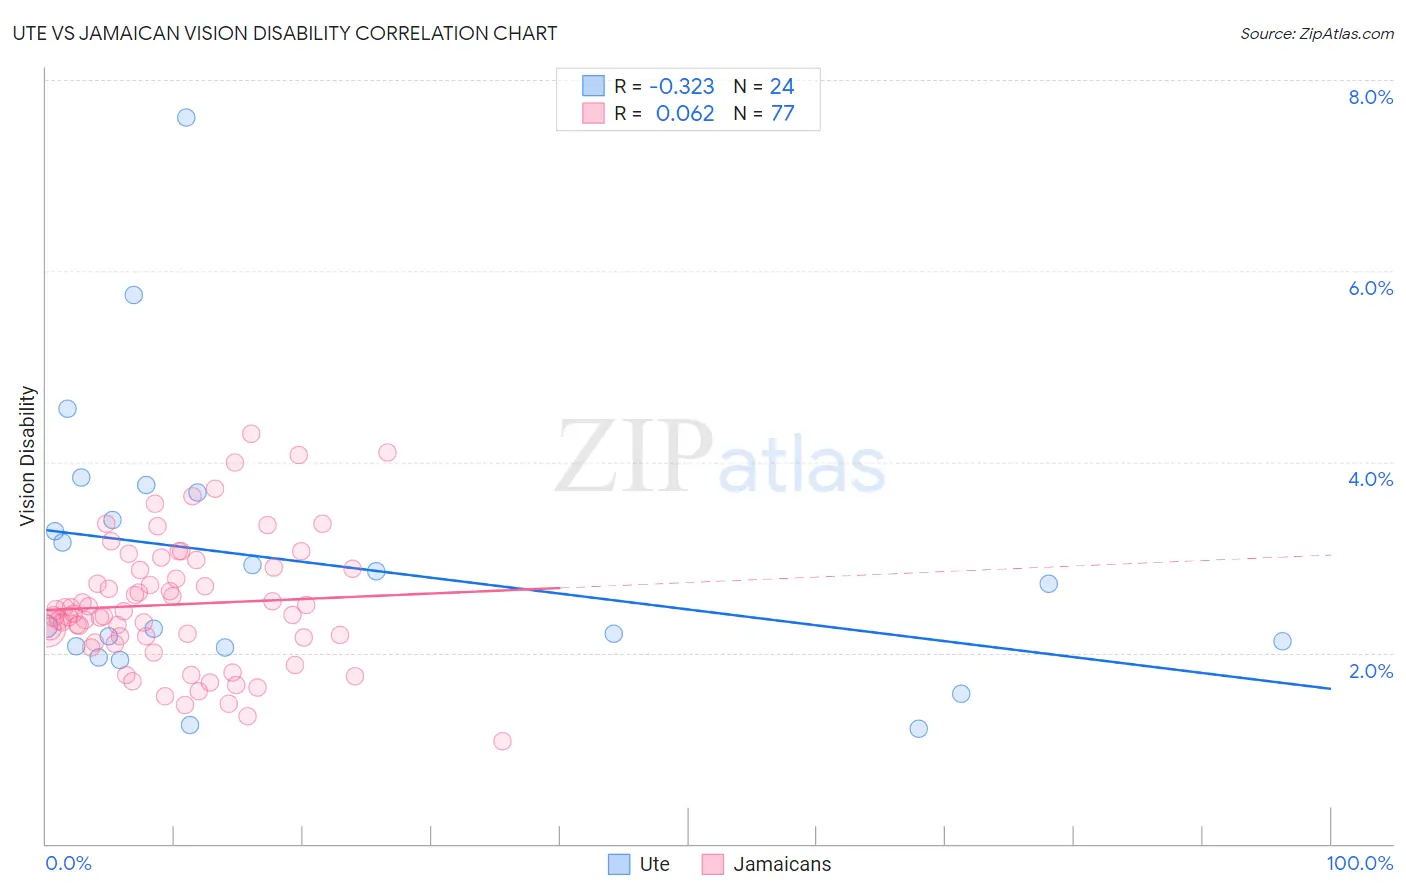
Ute vs Jamaican Vision Disability Correlation Chart
The statistical analysis conducted on geographies consisting of 55,653,653 people shows a mild negative correlation between the proportion of Ute and percentage of population with vision disability in the United States with a correlation coefficient (R) of -0.323 and weighted average of 2.4%. Similarly, the statistical analysis conducted on geographies consisting of 367,713,681 people shows a slight positive correlation between the proportion of Jamaicans and percentage of population with vision disability in the United States with a correlation coefficient (R) of 0.062 and weighted average of 2.4%, a difference of 0.46%.
Vision Disability Correlation Summary
| Measurement | Ute | Jamaican |
| Minimum | 1.2% | 1.1% |
| Maximum | 7.6% | 4.3% |
| Range | 6.4% | 3.2% |
| Mean | 2.9% | 2.5% |
| Median | 2.5% | 2.4% |
| Interquartile 25% (IQ1) | 2.1% | 2.1% |
| Interquartile 75% (IQ3) | 3.5% | 2.9% |
| Interquartile Range (IQR) | 1.5% | 0.76% |
| Standard Deviation (Sample) | 1.5% | 0.67% |
| Standard Deviation (Population) | 1.4% | 0.67% |
Demographics Similar to Ute and Jamaicans by Vision Disability
In terms of vision disability, the demographic groups most similar to Ute are Mexican American Indian (2.4%, a difference of 0.010%), Immigrants from Jamaica (2.4%, a difference of 0.050%), Immigrants from Liberia (2.4%, a difference of 0.080%), Senegalese (2.4%, a difference of 0.090%), and Immigrants from Belize (2.4%, a difference of 0.20%). Similarly, the demographic groups most similar to Jamaicans are Fijian (2.4%, a difference of 0.030%), Belizean (2.4%, a difference of 0.24%), Immigrants from Belize (2.4%, a difference of 0.26%), Immigrants from Liberia (2.4%, a difference of 0.38%), and Immigrants from Jamaica (2.4%, a difference of 0.40%).
| Demographics | Rating | Rank | Vision Disability |
| Haitians | 0.3 /100 | #254 | Tragic 2.4% |
| Immigrants | Guatemala | 0.3 /100 | #255 | Tragic 2.4% |
| Immigrants | Haiti | 0.2 /100 | #256 | Tragic 2.4% |
| West Indians | 0.2 /100 | #257 | Tragic 2.4% |
| British West Indians | 0.2 /100 | #258 | Tragic 2.4% |
| Whites/Caucasians | 0.2 /100 | #259 | Tragic 2.4% |
| Belizeans | 0.2 /100 | #260 | Tragic 2.4% |
| Fijians | 0.1 /100 | #261 | Tragic 2.4% |
| Jamaicans | 0.1 /100 | #262 | Tragic 2.4% |
| Immigrants | Belize | 0.1 /100 | #263 | Tragic 2.4% |
| Immigrants | Liberia | 0.1 /100 | #264 | Tragic 2.4% |
| Immigrants | Jamaica | 0.1 /100 | #265 | Tragic 2.4% |
| Mexican American Indians | 0.1 /100 | #266 | Tragic 2.4% |
| Ute | 0.1 /100 | #267 | Tragic 2.4% |
| Senegalese | 0.1 /100 | #268 | Tragic 2.4% |
| Celtics | 0.1 /100 | #269 | Tragic 2.4% |
| Cubans | 0.1 /100 | #270 | Tragic 2.4% |
| Immigrants | Azores | 0.1 /100 | #271 | Tragic 2.4% |
| Spaniards | 0.1 /100 | #272 | Tragic 2.4% |
| Immigrants | Bahamas | 0.1 /100 | #273 | Tragic 2.4% |
| Immigrants | Latin America | 0.0 /100 | #274 | Tragic 2.4% |