Scandinavian vs Immigrants from Denmark Ambulatory Disability
COMPARE
Scandinavian
Immigrants from Denmark
Ambulatory Disability
Ambulatory Disability Comparison
Scandinavians
Immigrants from Denmark
6.1%
AMBULATORY DISABILITY
44.5/ 100
METRIC RATING
178th/ 347
METRIC RANK
5.8%
AMBULATORY DISABILITY
98.6/ 100
METRIC RATING
93rd/ 347
METRIC RANK
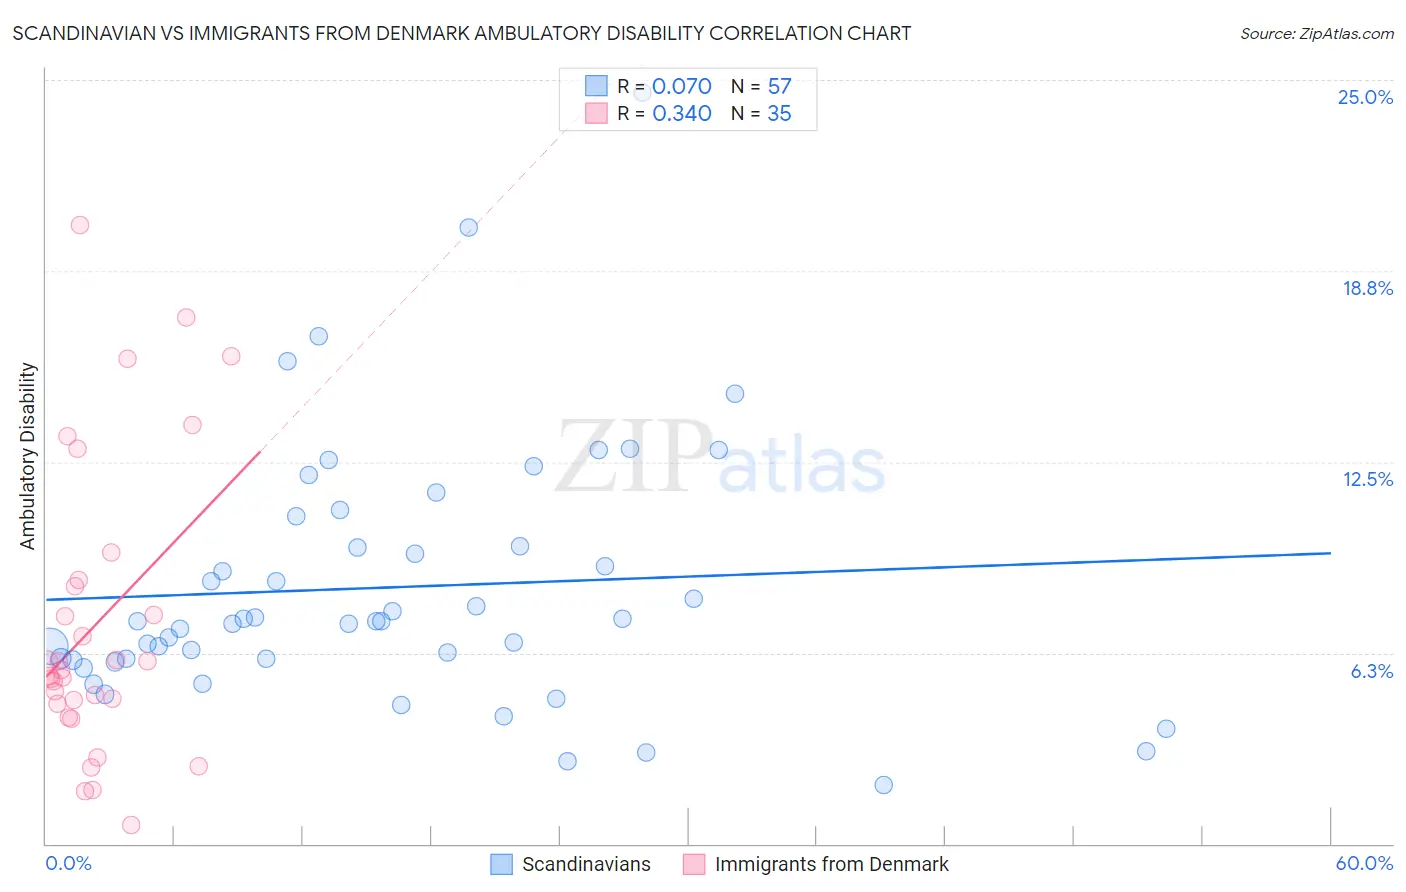
Scandinavian vs Immigrants from Denmark Ambulatory Disability Correlation Chart
The statistical analysis conducted on geographies consisting of 472,401,593 people shows a slight positive correlation between the proportion of Scandinavians and percentage of population with ambulatory disability in the United States with a correlation coefficient (R) of 0.070 and weighted average of 6.1%. Similarly, the statistical analysis conducted on geographies consisting of 136,424,948 people shows a mild positive correlation between the proportion of Immigrants from Denmark and percentage of population with ambulatory disability in the United States with a correlation coefficient (R) of 0.340 and weighted average of 5.8%, a difference of 6.3%.
Ambulatory Disability Correlation Summary
| Measurement | Scandinavian | Immigrants from Denmark |
| Minimum | 1.9% | 0.61% |
| Maximum | 24.6% | 20.3% |
| Range | 22.7% | 19.6% |
| Mean | 8.4% | 7.2% |
| Median | 7.3% | 5.7% |
| Interquartile 25% (IQ1) | 6.0% | 4.6% |
| Interquartile 75% (IQ3) | 10.2% | 8.7% |
| Interquartile Range (IQR) | 4.2% | 4.1% |
| Standard Deviation (Sample) | 4.2% | 4.8% |
| Standard Deviation (Population) | 4.2% | 4.7% |
Similar Demographics by Ambulatory Disability
Demographics Similar to Scandinavians by Ambulatory Disability
In terms of ambulatory disability, the demographic groups most similar to Scandinavians are Austrian (6.1%, a difference of 0.020%), Immigrants from Nicaragua (6.1%, a difference of 0.030%), Immigrants from England (6.1%, a difference of 0.050%), Immigrants from North America (6.1%, a difference of 0.060%), and Swiss (6.1%, a difference of 0.080%).
| Demographics | Rating | Rank | Ambulatory Disability |
| Moroccans | 52.6 /100 | #171 | Average 6.1% |
| Immigrants | Burma/Myanmar | 52.2 /100 | #172 | Average 6.1% |
| Croatians | 51.2 /100 | #173 | Average 6.1% |
| Immigrants | Canada | 50.0 /100 | #174 | Average 6.1% |
| Vietnamese | 47.2 /100 | #175 | Average 6.1% |
| Immigrants | North America | 45.6 /100 | #176 | Average 6.1% |
| Immigrants | England | 45.4 /100 | #177 | Average 6.1% |
| Scandinavians | 44.5 /100 | #178 | Average 6.1% |
| Austrians | 44.1 /100 | #179 | Average 6.1% |
| Immigrants | Nicaragua | 43.9 /100 | #180 | Average 6.1% |
| Swiss | 43.1 /100 | #181 | Average 6.1% |
| Serbians | 42.8 /100 | #182 | Average 6.1% |
| Immigrants | Thailand | 42.2 /100 | #183 | Average 6.1% |
| Immigrants | Ghana | 41.2 /100 | #184 | Average 6.1% |
| Immigrants | Bosnia and Herzegovina | 37.2 /100 | #185 | Fair 6.2% |
Demographics Similar to Immigrants from Denmark by Ambulatory Disability
In terms of ambulatory disability, the demographic groups most similar to Immigrants from Denmark are Immigrants from Sierra Leone (5.8%, a difference of 0.010%), Immigrants from Sudan (5.8%, a difference of 0.17%), Bhutanese (5.8%, a difference of 0.18%), Australian (5.8%, a difference of 0.18%), and Kenyan (5.8%, a difference of 0.19%).
| Demographics | Rating | Rank | Ambulatory Disability |
| Latvians | 99.0 /100 | #86 | Exceptional 5.7% |
| Immigrants | Chile | 98.9 /100 | #87 | Exceptional 5.8% |
| Soviet Union | 98.9 /100 | #88 | Exceptional 5.8% |
| Bhutanese | 98.8 /100 | #89 | Exceptional 5.8% |
| Australians | 98.8 /100 | #90 | Exceptional 5.8% |
| Immigrants | Sudan | 98.8 /100 | #91 | Exceptional 5.8% |
| Immigrants | Sierra Leone | 98.6 /100 | #92 | Exceptional 5.8% |
| Immigrants | Denmark | 98.6 /100 | #93 | Exceptional 5.8% |
| Kenyans | 98.4 /100 | #94 | Exceptional 5.8% |
| Immigrants | El Salvador | 98.4 /100 | #95 | Exceptional 5.8% |
| Salvadorans | 98.4 /100 | #96 | Exceptional 5.8% |
| Immigrants | Somalia | 98.3 /100 | #97 | Exceptional 5.8% |
| Immigrants | Lebanon | 98.3 /100 | #98 | Exceptional 5.8% |
| Immigrants | Northern Europe | 98.2 /100 | #99 | Exceptional 5.8% |
| Immigrants | Serbia | 97.9 /100 | #100 | Exceptional 5.8% |