Ute vs Immigrants from Iraq Disability Age 5 to 17
COMPARE
Ute
Immigrants from Iraq
Disability Age 5 to 17
Disability Age 5 to 17 Comparison
Ute
Immigrants from Iraq
5.5%
DISABILITY AGE 5 TO 17
80.6/ 100
METRIC RATING
152nd/ 347
METRIC RANK
5.6%
DISABILITY AGE 5 TO 17
53.9/ 100
METRIC RATING
171st/ 347
METRIC RANK
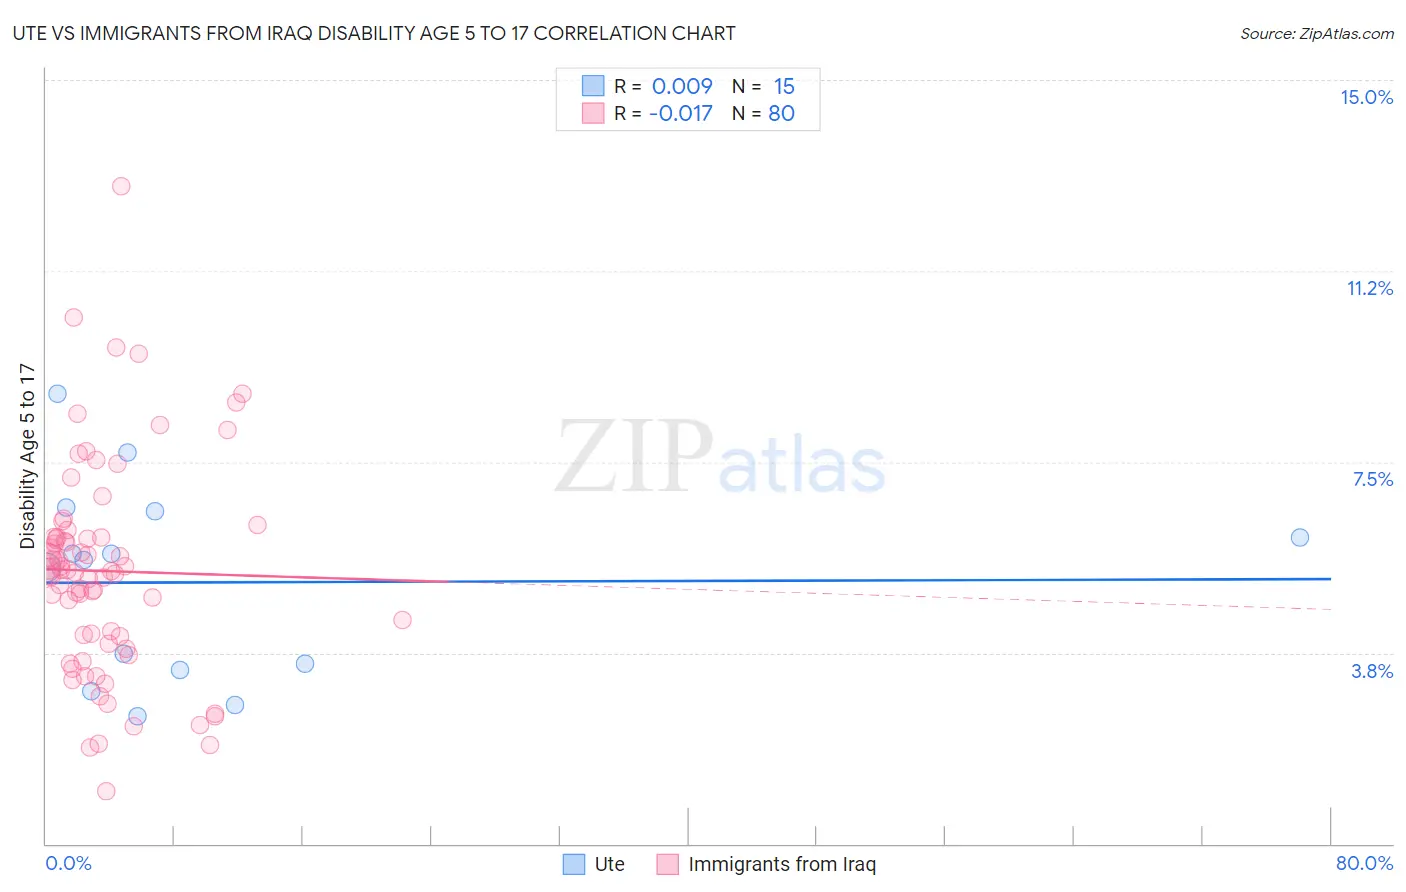
Ute vs Immigrants from Iraq Disability Age 5 to 17 Correlation Chart
The statistical analysis conducted on geographies consisting of 55,569,017 people shows no correlation between the proportion of Ute and percentage of population with a disability between the ages 5 and 17 in the United States with a correlation coefficient (R) of 0.009 and weighted average of 5.5%. Similarly, the statistical analysis conducted on geographies consisting of 194,133,073 people shows no correlation between the proportion of Immigrants from Iraq and percentage of population with a disability between the ages 5 and 17 in the United States with a correlation coefficient (R) of -0.017 and weighted average of 5.6%, a difference of 1.6%.
Disability Age 5 to 17 Correlation Summary
| Measurement | Ute | Immigrants from Iraq |
| Minimum | 2.5% | 1.0% |
| Maximum | 8.8% | 12.9% |
| Range | 6.3% | 11.9% |
| Mean | 5.1% | 5.4% |
| Median | 5.6% | 5.3% |
| Interquartile 25% (IQ1) | 3.4% | 4.0% |
| Interquartile 75% (IQ3) | 6.5% | 6.0% |
| Interquartile Range (IQR) | 3.1% | 2.0% |
| Standard Deviation (Sample) | 1.9% | 2.1% |
| Standard Deviation (Population) | 1.8% | 2.1% |
Demographics Similar to Ute and Immigrants from Iraq by Disability Age 5 to 17
In terms of disability age 5 to 17, the demographic groups most similar to Ute are Estonian (5.5%, a difference of 0.010%), Ecuadorian (5.5%, a difference of 0.070%), Australian (5.5%, a difference of 0.14%), Immigrants from Ecuador (5.5%, a difference of 0.18%), and Hawaiian (5.5%, a difference of 0.20%). Similarly, the demographic groups most similar to Immigrants from Iraq are Serbian (5.6%, a difference of 0.0%), Immigrants from Norway (5.6%, a difference of 0.090%), Iraqi (5.6%, a difference of 0.11%), Immigrants from Burma/Myanmar (5.6%, a difference of 0.27%), and Greek (5.6%, a difference of 0.34%).
| Demographics | Rating | Rank | Disability Age 5 to 17 |
| Estonians | 80.8 /100 | #151 | Excellent 5.5% |
| Ute | 80.6 /100 | #152 | Excellent 5.5% |
| Ecuadorians | 79.7 /100 | #153 | Good 5.5% |
| Australians | 78.8 /100 | #154 | Good 5.5% |
| Immigrants | Ecuador | 78.3 /100 | #155 | Good 5.5% |
| Hawaiians | 78.0 /100 | #156 | Good 5.5% |
| Immigrants | Costa Rica | 77.9 /100 | #157 | Good 5.5% |
| Immigrants | Nepal | 77.1 /100 | #158 | Good 5.5% |
| Immigrants | Zimbabwe | 75.3 /100 | #159 | Good 5.5% |
| South Africans | 73.3 /100 | #160 | Good 5.5% |
| Immigrants | Saudi Arabia | 69.1 /100 | #161 | Good 5.5% |
| Zimbabweans | 67.2 /100 | #162 | Good 5.5% |
| Immigrants | Southern Europe | 64.0 /100 | #163 | Good 5.6% |
| Immigrants | Scotland | 61.9 /100 | #164 | Good 5.6% |
| Lebanese | 61.4 /100 | #165 | Good 5.6% |
| Greeks | 60.6 /100 | #166 | Good 5.6% |
| Immigrants | Burma/Myanmar | 59.3 /100 | #167 | Average 5.6% |
| Iraqis | 56.0 /100 | #168 | Average 5.6% |
| Immigrants | Norway | 55.7 /100 | #169 | Average 5.6% |
| Serbians | 54.0 /100 | #170 | Average 5.6% |
| Immigrants | Iraq | 53.9 /100 | #171 | Average 5.6% |