U.S. Virgin Islander vs Greek Hearing Disability
COMPARE
U.S. Virgin Islander
Greek
Hearing Disability
Hearing Disability Comparison
U.S. Virgin Islanders
Greeks
2.8%
HEARING DISABILITY
92.5/ 100
METRIC RATING
112th/ 347
METRIC RANK
3.2%
HEARING DISABILITY
3.2/ 100
METRIC RATING
230th/ 347
METRIC RANK
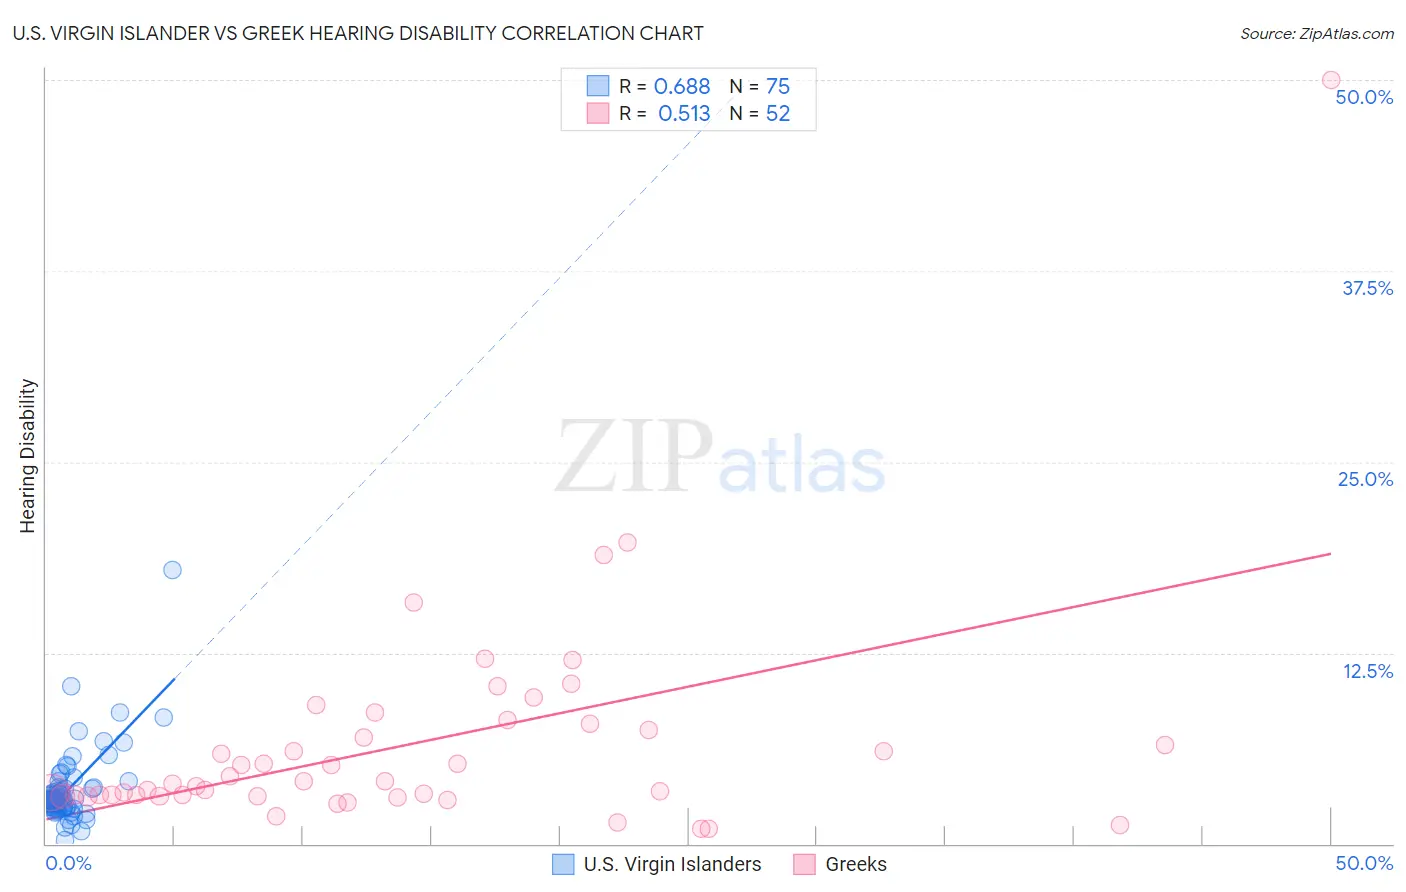
U.S. Virgin Islander vs Greek Hearing Disability Correlation Chart
The statistical analysis conducted on geographies consisting of 87,522,963 people shows a significant positive correlation between the proportion of U.S. Virgin Islanders and percentage of population with hearing disability in the United States with a correlation coefficient (R) of 0.688 and weighted average of 2.8%. Similarly, the statistical analysis conducted on geographies consisting of 482,523,980 people shows a substantial positive correlation between the proportion of Greeks and percentage of population with hearing disability in the United States with a correlation coefficient (R) of 0.513 and weighted average of 3.2%, a difference of 14.7%.
Hearing Disability Correlation Summary
| Measurement | U.S. Virgin Islander | Greek |
| Minimum | 0.26% | 1.0% |
| Maximum | 17.9% | 50.0% |
| Range | 17.7% | 49.0% |
| Mean | 3.5% | 6.5% |
| Median | 2.9% | 4.0% |
| Interquartile 25% (IQ1) | 2.4% | 3.2% |
| Interquartile 75% (IQ3) | 3.6% | 7.6% |
| Interquartile Range (IQR) | 1.3% | 4.5% |
| Standard Deviation (Sample) | 2.4% | 7.4% |
| Standard Deviation (Population) | 2.4% | 7.4% |
Similar Demographics by Hearing Disability
Demographics Similar to U.S. Virgin Islanders by Hearing Disability
In terms of hearing disability, the demographic groups most similar to U.S. Virgin Islanders are Immigrants from Yemen (2.8%, a difference of 0.070%), Cypriot (2.8%, a difference of 0.12%), Turkish (2.8%, a difference of 0.17%), Guatemalan (2.8%, a difference of 0.24%), and Immigrants from Belarus (2.8%, a difference of 0.31%).
| Demographics | Rating | Rank | Hearing Disability |
| Moroccans | 93.9 /100 | #105 | Exceptional 2.8% |
| Hondurans | 93.4 /100 | #106 | Exceptional 2.8% |
| Immigrants | Chile | 93.4 /100 | #107 | Exceptional 2.8% |
| Guatemalans | 93.2 /100 | #108 | Exceptional 2.8% |
| Turks | 93.0 /100 | #109 | Exceptional 2.8% |
| Cypriots | 92.9 /100 | #110 | Exceptional 2.8% |
| Immigrants | Yemen | 92.7 /100 | #111 | Exceptional 2.8% |
| U.S. Virgin Islanders | 92.5 /100 | #112 | Exceptional 2.8% |
| Immigrants | Belarus | 91.6 /100 | #113 | Exceptional 2.8% |
| Cambodians | 91.1 /100 | #114 | Exceptional 2.8% |
| Immigrants | Latin America | 90.5 /100 | #115 | Exceptional 2.8% |
| Immigrants | Immigrants | 90.3 /100 | #116 | Exceptional 2.8% |
| Immigrants | Liberia | 90.0 /100 | #117 | Excellent 2.8% |
| Zimbabweans | 89.9 /100 | #118 | Excellent 2.8% |
| Kenyans | 89.8 /100 | #119 | Excellent 2.8% |
Demographics Similar to Greeks by Hearing Disability
In terms of hearing disability, the demographic groups most similar to Greeks are Luxembourger (3.2%, a difference of 0.23%), Ukrainian (3.2%, a difference of 0.28%), Maltese (3.2%, a difference of 0.51%), Immigrants from Portugal (3.2%, a difference of 0.62%), and Estonian (3.3%, a difference of 0.65%).
| Demographics | Rating | Rank | Hearing Disability |
| Mexicans | 5.6 /100 | #223 | Tragic 3.2% |
| Icelanders | 5.2 /100 | #224 | Tragic 3.2% |
| Latvians | 5.1 /100 | #225 | Tragic 3.2% |
| Lebanese | 5.0 /100 | #226 | Tragic 3.2% |
| Bhutanese | 4.6 /100 | #227 | Tragic 3.2% |
| Immigrants | Portugal | 4.3 /100 | #228 | Tragic 3.2% |
| Maltese | 4.1 /100 | #229 | Tragic 3.2% |
| Greeks | 3.2 /100 | #230 | Tragic 3.2% |
| Luxembourgers | 2.9 /100 | #231 | Tragic 3.2% |
| Ukrainians | 2.9 /100 | #232 | Tragic 3.2% |
| Estonians | 2.4 /100 | #233 | Tragic 3.3% |
| Central American Indians | 2.3 /100 | #234 | Tragic 3.3% |
| Guamanians/Chamorros | 2.2 /100 | #235 | Tragic 3.3% |
| Serbians | 2.2 /100 | #236 | Tragic 3.3% |
| Immigrants | Austria | 1.8 /100 | #237 | Tragic 3.3% |