U.S. Virgin Islander vs African Hearing Disability
COMPARE
U.S. Virgin Islander
African
Hearing Disability
Hearing Disability Comparison
U.S. Virgin Islanders
Africans
2.8%
HEARING DISABILITY
92.5/ 100
METRIC RATING
112th/ 347
METRIC RANK
3.0%
HEARING DISABILITY
32.9/ 100
METRIC RATING
189th/ 347
METRIC RANK
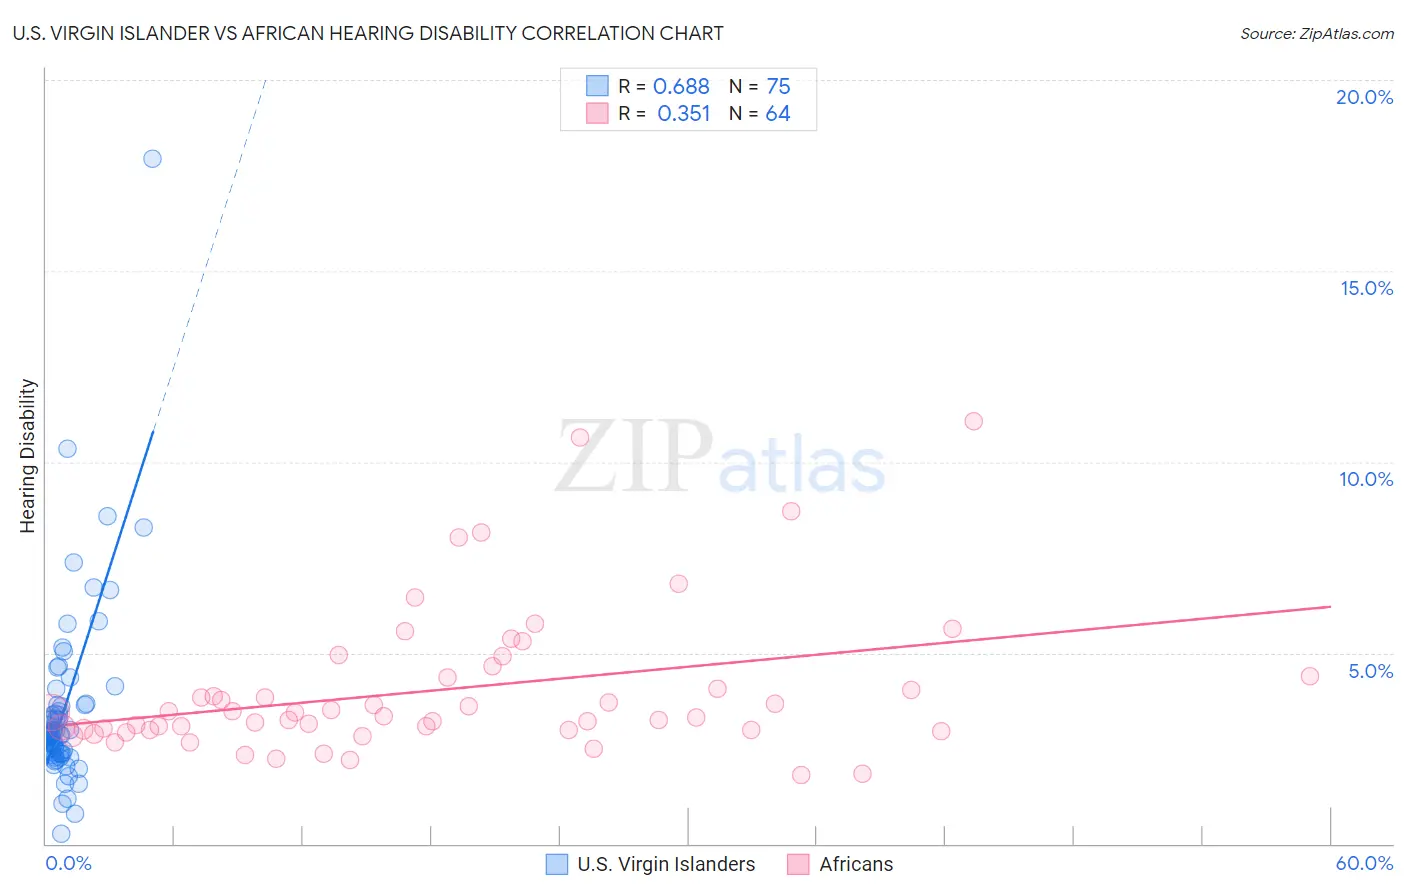
U.S. Virgin Islander vs African Hearing Disability Correlation Chart
The statistical analysis conducted on geographies consisting of 87,522,963 people shows a significant positive correlation between the proportion of U.S. Virgin Islanders and percentage of population with hearing disability in the United States with a correlation coefficient (R) of 0.688 and weighted average of 2.8%. Similarly, the statistical analysis conducted on geographies consisting of 469,733,776 people shows a mild positive correlation between the proportion of Africans and percentage of population with hearing disability in the United States with a correlation coefficient (R) of 0.351 and weighted average of 3.0%, a difference of 8.1%.
Hearing Disability Correlation Summary
| Measurement | U.S. Virgin Islander | African |
| Minimum | 0.26% | 1.8% |
| Maximum | 17.9% | 11.1% |
| Range | 17.7% | 9.3% |
| Mean | 3.5% | 4.0% |
| Median | 2.9% | 3.4% |
| Interquartile 25% (IQ1) | 2.4% | 3.0% |
| Interquartile 75% (IQ3) | 3.6% | 4.4% |
| Interquartile Range (IQR) | 1.3% | 1.4% |
| Standard Deviation (Sample) | 2.4% | 1.9% |
| Standard Deviation (Population) | 2.4% | 1.9% |
Similar Demographics by Hearing Disability
Demographics Similar to U.S. Virgin Islanders by Hearing Disability
In terms of hearing disability, the demographic groups most similar to U.S. Virgin Islanders are Immigrants from Yemen (2.8%, a difference of 0.070%), Cypriot (2.8%, a difference of 0.12%), Turkish (2.8%, a difference of 0.17%), Guatemalan (2.8%, a difference of 0.24%), and Immigrants from Belarus (2.8%, a difference of 0.31%).
| Demographics | Rating | Rank | Hearing Disability |
| Moroccans | 93.9 /100 | #105 | Exceptional 2.8% |
| Hondurans | 93.4 /100 | #106 | Exceptional 2.8% |
| Immigrants | Chile | 93.4 /100 | #107 | Exceptional 2.8% |
| Guatemalans | 93.2 /100 | #108 | Exceptional 2.8% |
| Turks | 93.0 /100 | #109 | Exceptional 2.8% |
| Cypriots | 92.9 /100 | #110 | Exceptional 2.8% |
| Immigrants | Yemen | 92.7 /100 | #111 | Exceptional 2.8% |
| U.S. Virgin Islanders | 92.5 /100 | #112 | Exceptional 2.8% |
| Immigrants | Belarus | 91.6 /100 | #113 | Exceptional 2.8% |
| Cambodians | 91.1 /100 | #114 | Exceptional 2.8% |
| Immigrants | Latin America | 90.5 /100 | #115 | Exceptional 2.8% |
| Immigrants | Immigrants | 90.3 /100 | #116 | Exceptional 2.8% |
| Immigrants | Liberia | 90.0 /100 | #117 | Excellent 2.8% |
| Zimbabweans | 89.9 /100 | #118 | Excellent 2.8% |
| Kenyans | 89.8 /100 | #119 | Excellent 2.8% |
Demographics Similar to Africans by Hearing Disability
In terms of hearing disability, the demographic groups most similar to Africans are Black/African American (3.0%, a difference of 0.19%), Mexican American Indian (3.0%, a difference of 0.19%), Immigrants from South Africa (3.1%, a difference of 0.19%), Immigrants from Mexico (3.0%, a difference of 0.21%), and Immigrants from Southern Europe (3.0%, a difference of 0.25%).
| Demographics | Rating | Rank | Hearing Disability |
| Immigrants | Italy | 41.1 /100 | #182 | Average 3.0% |
| Bulgarians | 39.7 /100 | #183 | Fair 3.0% |
| Immigrants | Ireland | 37.4 /100 | #184 | Fair 3.0% |
| Immigrants | Southern Europe | 35.3 /100 | #185 | Fair 3.0% |
| Immigrants | Mexico | 34.9 /100 | #186 | Fair 3.0% |
| Blacks/African Americans | 34.7 /100 | #187 | Fair 3.0% |
| Mexican American Indians | 34.7 /100 | #188 | Fair 3.0% |
| Africans | 32.9 /100 | #189 | Fair 3.0% |
| Immigrants | South Africa | 31.1 /100 | #190 | Fair 3.1% |
| Immigrants | Switzerland | 28.8 /100 | #191 | Fair 3.1% |
| Koreans | 27.6 /100 | #192 | Fair 3.1% |
| Macedonians | 27.0 /100 | #193 | Fair 3.1% |
| South Africans | 24.5 /100 | #194 | Fair 3.1% |
| Spanish American Indians | 24.1 /100 | #195 | Fair 3.1% |
| Immigrants | Europe | 22.9 /100 | #196 | Fair 3.1% |