Immigrants from Eastern Africa vs Greek Hearing Disability
COMPARE
Immigrants from Eastern Africa
Greek
Hearing Disability
Hearing Disability Comparison
Immigrants from Eastern Africa
Greeks
2.8%
HEARING DISABILITY
95.0/ 100
METRIC RATING
100th/ 347
METRIC RANK
3.2%
HEARING DISABILITY
3.2/ 100
METRIC RATING
230th/ 347
METRIC RANK
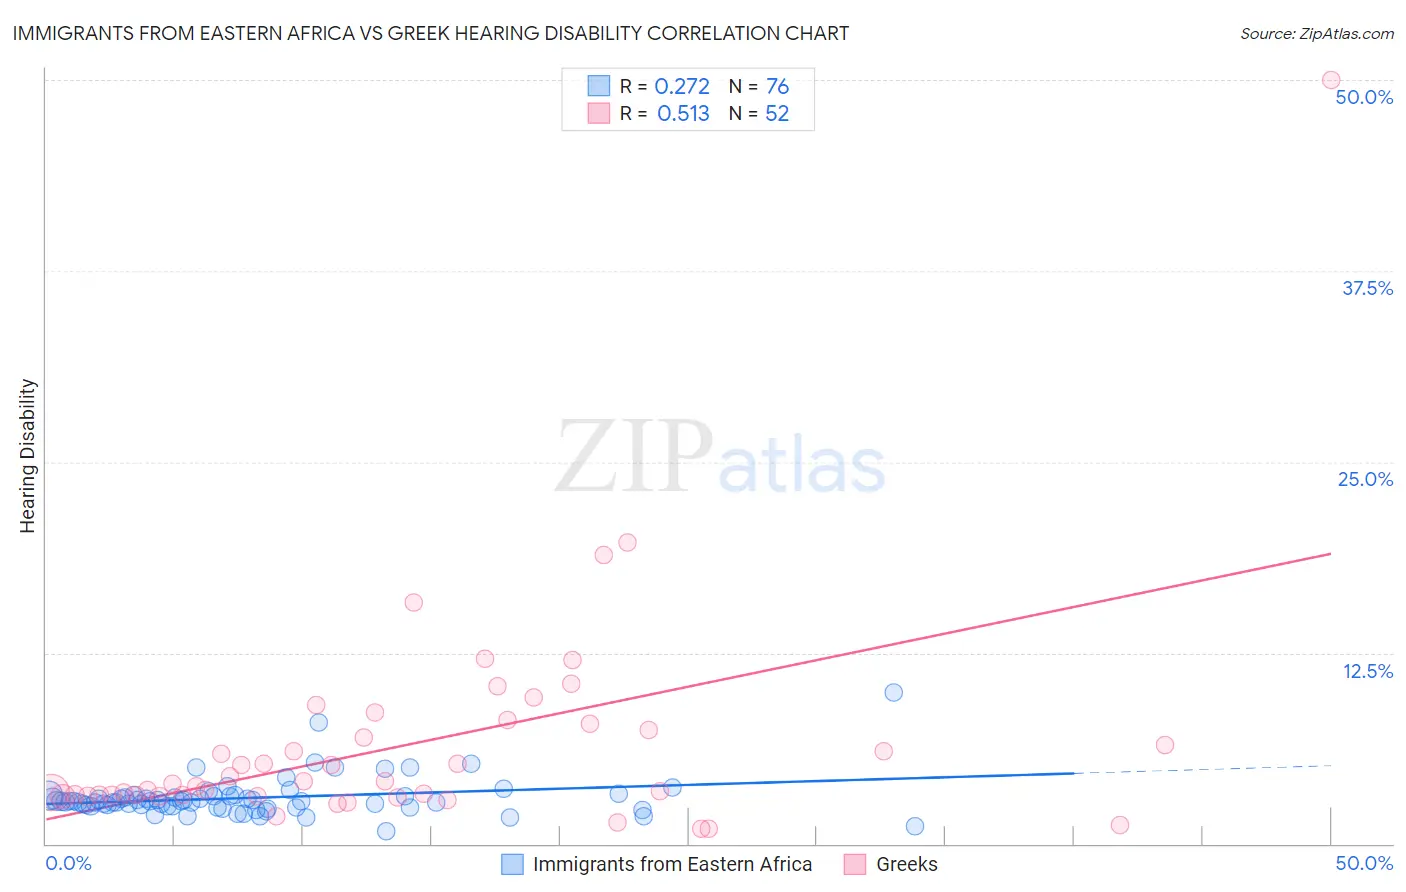
Immigrants from Eastern Africa vs Greek Hearing Disability Correlation Chart
The statistical analysis conducted on geographies consisting of 355,030,824 people shows a weak positive correlation between the proportion of Immigrants from Eastern Africa and percentage of population with hearing disability in the United States with a correlation coefficient (R) of 0.272 and weighted average of 2.8%. Similarly, the statistical analysis conducted on geographies consisting of 482,523,980 people shows a substantial positive correlation between the proportion of Greeks and percentage of population with hearing disability in the United States with a correlation coefficient (R) of 0.513 and weighted average of 3.2%, a difference of 16.0%.
Hearing Disability Correlation Summary
| Measurement | Immigrants from Eastern Africa | Greek |
| Minimum | 0.83% | 1.0% |
| Maximum | 9.9% | 50.0% |
| Range | 9.1% | 49.0% |
| Mean | 3.0% | 6.5% |
| Median | 2.8% | 4.0% |
| Interquartile 25% (IQ1) | 2.4% | 3.2% |
| Interquartile 75% (IQ3) | 3.1% | 7.6% |
| Interquartile Range (IQR) | 0.68% | 4.5% |
| Standard Deviation (Sample) | 1.3% | 7.4% |
| Standard Deviation (Population) | 1.3% | 7.4% |
Similar Demographics by Hearing Disability
Demographics Similar to Immigrants from Eastern Africa by Hearing Disability
In terms of hearing disability, the demographic groups most similar to Immigrants from Eastern Africa are Immigrants from Guatemala (2.8%, a difference of 0.050%), Immigrants from Spain (2.8%, a difference of 0.050%), Taiwanese (2.8%, a difference of 0.070%), Immigrants from Honduras (2.8%, a difference of 0.090%), and Immigrants from Indonesia (2.8%, a difference of 0.12%).
| Demographics | Rating | Rank | Hearing Disability |
| Immigrants | Kuwait | 96.3 /100 | #93 | Exceptional 2.8% |
| Uruguayans | 95.9 /100 | #94 | Exceptional 2.8% |
| Israelis | 95.9 /100 | #95 | Exceptional 2.8% |
| Immigrants | Somalia | 95.5 /100 | #96 | Exceptional 2.8% |
| Immigrants | Afghanistan | 95.3 /100 | #97 | Exceptional 2.8% |
| Immigrants | Honduras | 95.1 /100 | #98 | Exceptional 2.8% |
| Immigrants | Guatemala | 95.1 /100 | #99 | Exceptional 2.8% |
| Immigrants | Eastern Africa | 95.0 /100 | #100 | Exceptional 2.8% |
| Immigrants | Spain | 94.9 /100 | #101 | Exceptional 2.8% |
| Taiwanese | 94.8 /100 | #102 | Exceptional 2.8% |
| Immigrants | Indonesia | 94.7 /100 | #103 | Exceptional 2.8% |
| Burmese | 94.2 /100 | #104 | Exceptional 2.8% |
| Moroccans | 93.9 /100 | #105 | Exceptional 2.8% |
| Hondurans | 93.4 /100 | #106 | Exceptional 2.8% |
| Immigrants | Chile | 93.4 /100 | #107 | Exceptional 2.8% |
Demographics Similar to Greeks by Hearing Disability
In terms of hearing disability, the demographic groups most similar to Greeks are Luxembourger (3.2%, a difference of 0.23%), Ukrainian (3.2%, a difference of 0.28%), Maltese (3.2%, a difference of 0.51%), Immigrants from Portugal (3.2%, a difference of 0.62%), and Estonian (3.3%, a difference of 0.65%).
| Demographics | Rating | Rank | Hearing Disability |
| Mexicans | 5.6 /100 | #223 | Tragic 3.2% |
| Icelanders | 5.2 /100 | #224 | Tragic 3.2% |
| Latvians | 5.1 /100 | #225 | Tragic 3.2% |
| Lebanese | 5.0 /100 | #226 | Tragic 3.2% |
| Bhutanese | 4.6 /100 | #227 | Tragic 3.2% |
| Immigrants | Portugal | 4.3 /100 | #228 | Tragic 3.2% |
| Maltese | 4.1 /100 | #229 | Tragic 3.2% |
| Greeks | 3.2 /100 | #230 | Tragic 3.2% |
| Luxembourgers | 2.9 /100 | #231 | Tragic 3.2% |
| Ukrainians | 2.9 /100 | #232 | Tragic 3.2% |
| Estonians | 2.4 /100 | #233 | Tragic 3.3% |
| Central American Indians | 2.3 /100 | #234 | Tragic 3.3% |
| Guamanians/Chamorros | 2.2 /100 | #235 | Tragic 3.3% |
| Serbians | 2.2 /100 | #236 | Tragic 3.3% |
| Immigrants | Austria | 1.8 /100 | #237 | Tragic 3.3% |