Immigrants from Sweden vs Greek Hearing Disability
COMPARE
Immigrants from Sweden
Greek
Hearing Disability
Hearing Disability Comparison
Immigrants from Sweden
Greeks
3.0%
HEARING DISABILITY
42.4/ 100
METRIC RATING
180th/ 347
METRIC RANK
3.2%
HEARING DISABILITY
3.2/ 100
METRIC RATING
230th/ 347
METRIC RANK
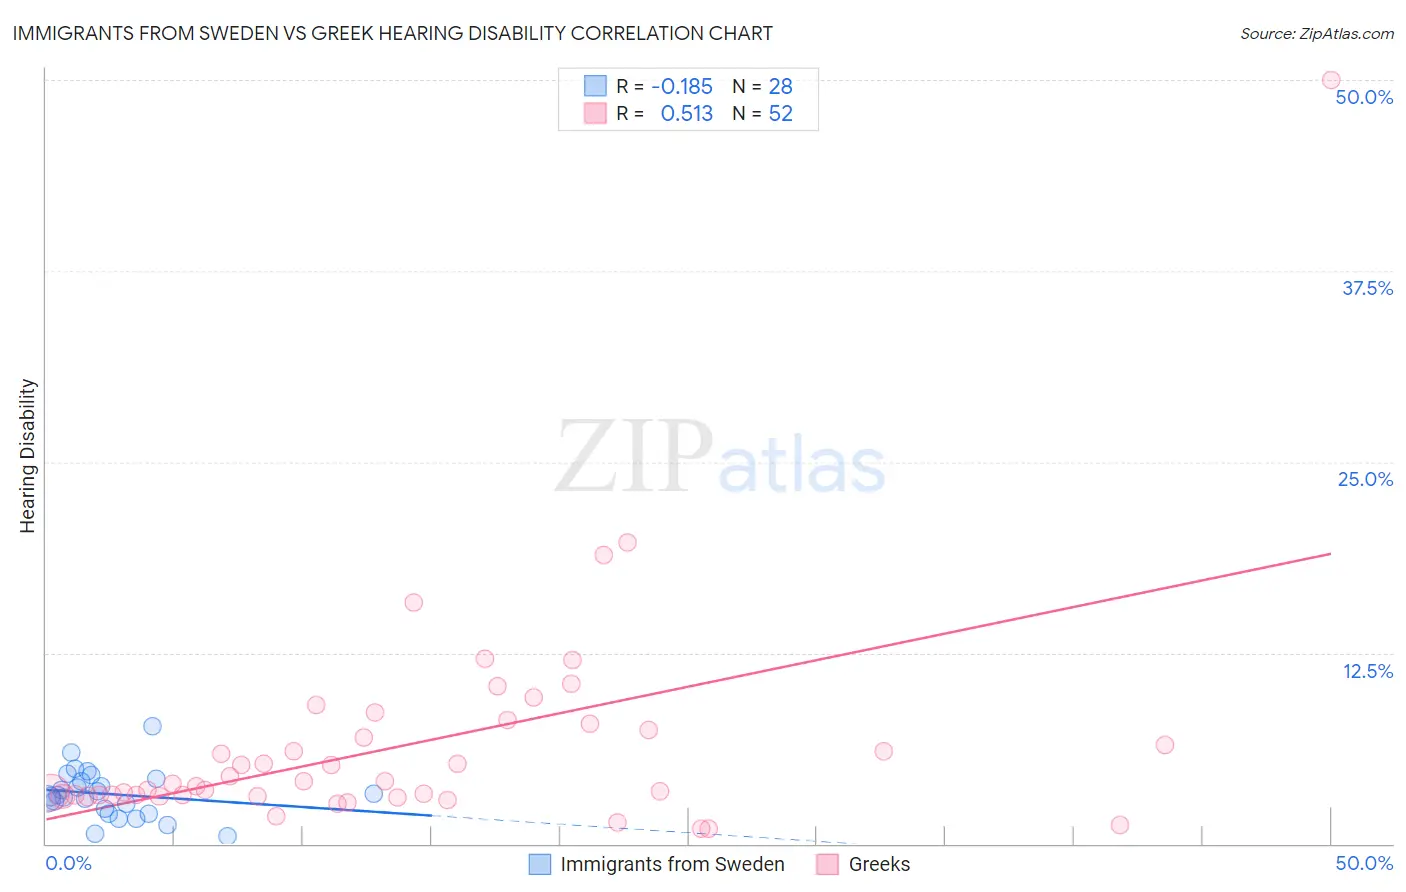
Immigrants from Sweden vs Greek Hearing Disability Correlation Chart
The statistical analysis conducted on geographies consisting of 164,738,655 people shows a poor negative correlation between the proportion of Immigrants from Sweden and percentage of population with hearing disability in the United States with a correlation coefficient (R) of -0.185 and weighted average of 3.0%. Similarly, the statistical analysis conducted on geographies consisting of 482,523,980 people shows a substantial positive correlation between the proportion of Greeks and percentage of population with hearing disability in the United States with a correlation coefficient (R) of 0.513 and weighted average of 3.2%, a difference of 7.2%.
Hearing Disability Correlation Summary
| Measurement | Immigrants from Sweden | Greek |
| Minimum | 0.51% | 1.0% |
| Maximum | 7.7% | 50.0% |
| Range | 7.2% | 49.0% |
| Mean | 3.3% | 6.5% |
| Median | 3.1% | 4.0% |
| Interquartile 25% (IQ1) | 2.1% | 3.2% |
| Interquartile 75% (IQ3) | 4.2% | 7.6% |
| Interquartile Range (IQR) | 2.1% | 4.5% |
| Standard Deviation (Sample) | 1.6% | 7.4% |
| Standard Deviation (Population) | 1.5% | 7.4% |
Similar Demographics by Hearing Disability
Demographics Similar to Immigrants from Sweden by Hearing Disability
In terms of hearing disability, the demographic groups most similar to Immigrants from Sweden are Immigrants from Moldova (3.0%, a difference of 0.060%), Immigrants from Belgium (3.0%, a difference of 0.090%), Immigrants from Italy (3.0%, a difference of 0.12%), Bulgarian (3.0%, a difference of 0.26%), and Japanese (3.0%, a difference of 0.34%).
| Demographics | Rating | Rank | Hearing Disability |
| Immigrants | Serbia | 51.1 /100 | #173 | Average 3.0% |
| Indonesians | 50.0 /100 | #174 | Average 3.0% |
| Immigrants | Romania | 48.4 /100 | #175 | Average 3.0% |
| Panamanians | 47.0 /100 | #176 | Average 3.0% |
| Immigrants | Philippines | 46.4 /100 | #177 | Average 3.0% |
| Japanese | 46.0 /100 | #178 | Average 3.0% |
| Immigrants | Moldova | 43.1 /100 | #179 | Average 3.0% |
| Immigrants | Sweden | 42.4 /100 | #180 | Average 3.0% |
| Immigrants | Belgium | 41.5 /100 | #181 | Average 3.0% |
| Immigrants | Italy | 41.1 /100 | #182 | Average 3.0% |
| Bulgarians | 39.7 /100 | #183 | Fair 3.0% |
| Immigrants | Ireland | 37.4 /100 | #184 | Fair 3.0% |
| Immigrants | Southern Europe | 35.3 /100 | #185 | Fair 3.0% |
| Immigrants | Mexico | 34.9 /100 | #186 | Fair 3.0% |
| Blacks/African Americans | 34.7 /100 | #187 | Fair 3.0% |
Demographics Similar to Greeks by Hearing Disability
In terms of hearing disability, the demographic groups most similar to Greeks are Luxembourger (3.2%, a difference of 0.23%), Ukrainian (3.2%, a difference of 0.28%), Maltese (3.2%, a difference of 0.51%), Immigrants from Portugal (3.2%, a difference of 0.62%), and Estonian (3.3%, a difference of 0.65%).
| Demographics | Rating | Rank | Hearing Disability |
| Mexicans | 5.6 /100 | #223 | Tragic 3.2% |
| Icelanders | 5.2 /100 | #224 | Tragic 3.2% |
| Latvians | 5.1 /100 | #225 | Tragic 3.2% |
| Lebanese | 5.0 /100 | #226 | Tragic 3.2% |
| Bhutanese | 4.6 /100 | #227 | Tragic 3.2% |
| Immigrants | Portugal | 4.3 /100 | #228 | Tragic 3.2% |
| Maltese | 4.1 /100 | #229 | Tragic 3.2% |
| Greeks | 3.2 /100 | #230 | Tragic 3.2% |
| Luxembourgers | 2.9 /100 | #231 | Tragic 3.2% |
| Ukrainians | 2.9 /100 | #232 | Tragic 3.2% |
| Estonians | 2.4 /100 | #233 | Tragic 3.3% |
| Central American Indians | 2.3 /100 | #234 | Tragic 3.3% |
| Guamanians/Chamorros | 2.2 /100 | #235 | Tragic 3.3% |
| Serbians | 2.2 /100 | #236 | Tragic 3.3% |
| Immigrants | Austria | 1.8 /100 | #237 | Tragic 3.3% |