U.S. Virgin Islander vs Yakama Hearing Disability
COMPARE
U.S. Virgin Islander
Yakama
Hearing Disability
Hearing Disability Comparison
U.S. Virgin Islanders
Yakama
2.8%
HEARING DISABILITY
92.5/ 100
METRIC RATING
112th/ 347
METRIC RANK
3.9%
HEARING DISABILITY
0.0/ 100
METRIC RATING
314th/ 347
METRIC RANK
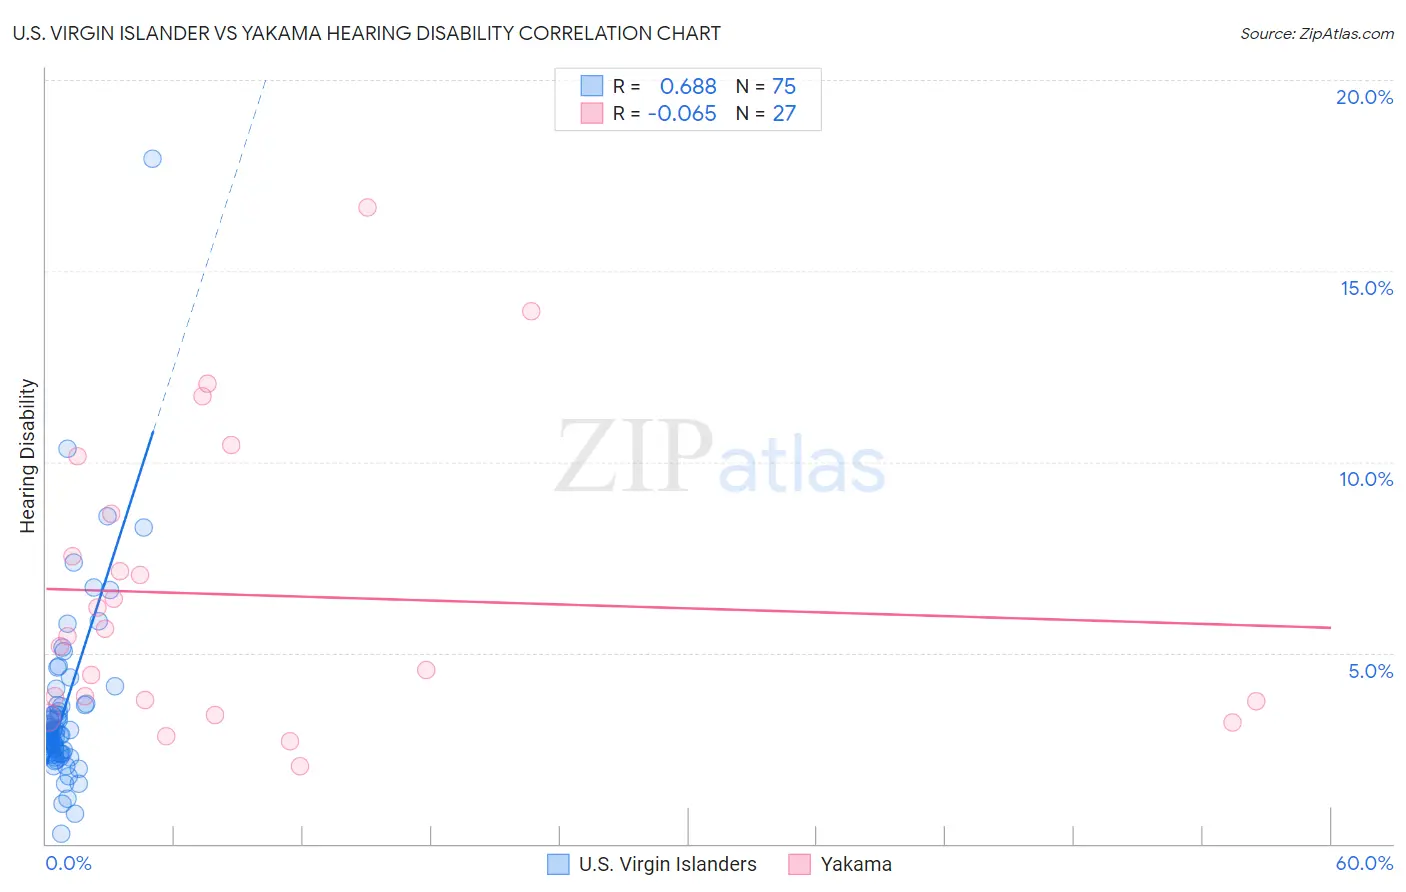
U.S. Virgin Islander vs Yakama Hearing Disability Correlation Chart
The statistical analysis conducted on geographies consisting of 87,522,963 people shows a significant positive correlation between the proportion of U.S. Virgin Islanders and percentage of population with hearing disability in the United States with a correlation coefficient (R) of 0.688 and weighted average of 2.8%. Similarly, the statistical analysis conducted on geographies consisting of 19,917,800 people shows a slight negative correlation between the proportion of Yakama and percentage of population with hearing disability in the United States with a correlation coefficient (R) of -0.065 and weighted average of 3.9%, a difference of 40.1%.
Hearing Disability Correlation Summary
| Measurement | U.S. Virgin Islander | Yakama |
| Minimum | 0.26% | 2.0% |
| Maximum | 17.9% | 16.7% |
| Range | 17.7% | 14.6% |
| Mean | 3.5% | 6.5% |
| Median | 2.9% | 5.4% |
| Interquartile 25% (IQ1) | 2.4% | 3.7% |
| Interquartile 75% (IQ3) | 3.6% | 8.6% |
| Interquartile Range (IQR) | 1.3% | 4.9% |
| Standard Deviation (Sample) | 2.4% | 3.8% |
| Standard Deviation (Population) | 2.4% | 3.7% |
Similar Demographics by Hearing Disability
Demographics Similar to U.S. Virgin Islanders by Hearing Disability
In terms of hearing disability, the demographic groups most similar to U.S. Virgin Islanders are Immigrants from Yemen (2.8%, a difference of 0.070%), Cypriot (2.8%, a difference of 0.12%), Turkish (2.8%, a difference of 0.17%), Guatemalan (2.8%, a difference of 0.24%), and Immigrants from Belarus (2.8%, a difference of 0.31%).
| Demographics | Rating | Rank | Hearing Disability |
| Moroccans | 93.9 /100 | #105 | Exceptional 2.8% |
| Hondurans | 93.4 /100 | #106 | Exceptional 2.8% |
| Immigrants | Chile | 93.4 /100 | #107 | Exceptional 2.8% |
| Guatemalans | 93.2 /100 | #108 | Exceptional 2.8% |
| Turks | 93.0 /100 | #109 | Exceptional 2.8% |
| Cypriots | 92.9 /100 | #110 | Exceptional 2.8% |
| Immigrants | Yemen | 92.7 /100 | #111 | Exceptional 2.8% |
| U.S. Virgin Islanders | 92.5 /100 | #112 | Exceptional 2.8% |
| Immigrants | Belarus | 91.6 /100 | #113 | Exceptional 2.8% |
| Cambodians | 91.1 /100 | #114 | Exceptional 2.8% |
| Immigrants | Latin America | 90.5 /100 | #115 | Exceptional 2.8% |
| Immigrants | Immigrants | 90.3 /100 | #116 | Exceptional 2.8% |
| Immigrants | Liberia | 90.0 /100 | #117 | Excellent 2.8% |
| Zimbabweans | 89.9 /100 | #118 | Excellent 2.8% |
| Kenyans | 89.8 /100 | #119 | Excellent 2.8% |
Demographics Similar to Yakama by Hearing Disability
In terms of hearing disability, the demographic groups most similar to Yakama are Puget Sound Salish (3.9%, a difference of 0.010%), Hopi (3.9%, a difference of 0.17%), Spanish American (4.0%, a difference of 0.21%), Cajun (3.9%, a difference of 0.28%), and Comanche (4.0%, a difference of 0.34%).
| Demographics | Rating | Rank | Hearing Disability |
| French Canadians | 0.0 /100 | #307 | Tragic 3.8% |
| Ottawa | 0.0 /100 | #308 | Tragic 3.8% |
| Scotch-Irish | 0.0 /100 | #309 | Tragic 3.8% |
| Cree | 0.0 /100 | #310 | Tragic 3.8% |
| Americans | 0.0 /100 | #311 | Tragic 3.9% |
| Cajuns | 0.0 /100 | #312 | Tragic 3.9% |
| Hopi | 0.0 /100 | #313 | Tragic 3.9% |
| Yakama | 0.0 /100 | #314 | Tragic 3.9% |
| Puget Sound Salish | 0.0 /100 | #315 | Tragic 3.9% |
| Spanish Americans | 0.0 /100 | #316 | Tragic 4.0% |
| Comanche | 0.0 /100 | #317 | Tragic 4.0% |
| Cheyenne | 0.0 /100 | #318 | Tragic 4.0% |
| Chippewa | 0.0 /100 | #319 | Tragic 4.0% |
| Shoshone | 0.0 /100 | #320 | Tragic 4.0% |
| Paiute | 0.0 /100 | #321 | Tragic 4.1% |