U.S. Virgin Islander vs Palestinian Hearing Disability
COMPARE
U.S. Virgin Islander
Palestinian
Hearing Disability
Hearing Disability Comparison
U.S. Virgin Islanders
Palestinians
2.8%
HEARING DISABILITY
92.5/ 100
METRIC RATING
112th/ 347
METRIC RANK
2.9%
HEARING DISABILITY
73.6/ 100
METRIC RATING
150th/ 347
METRIC RANK
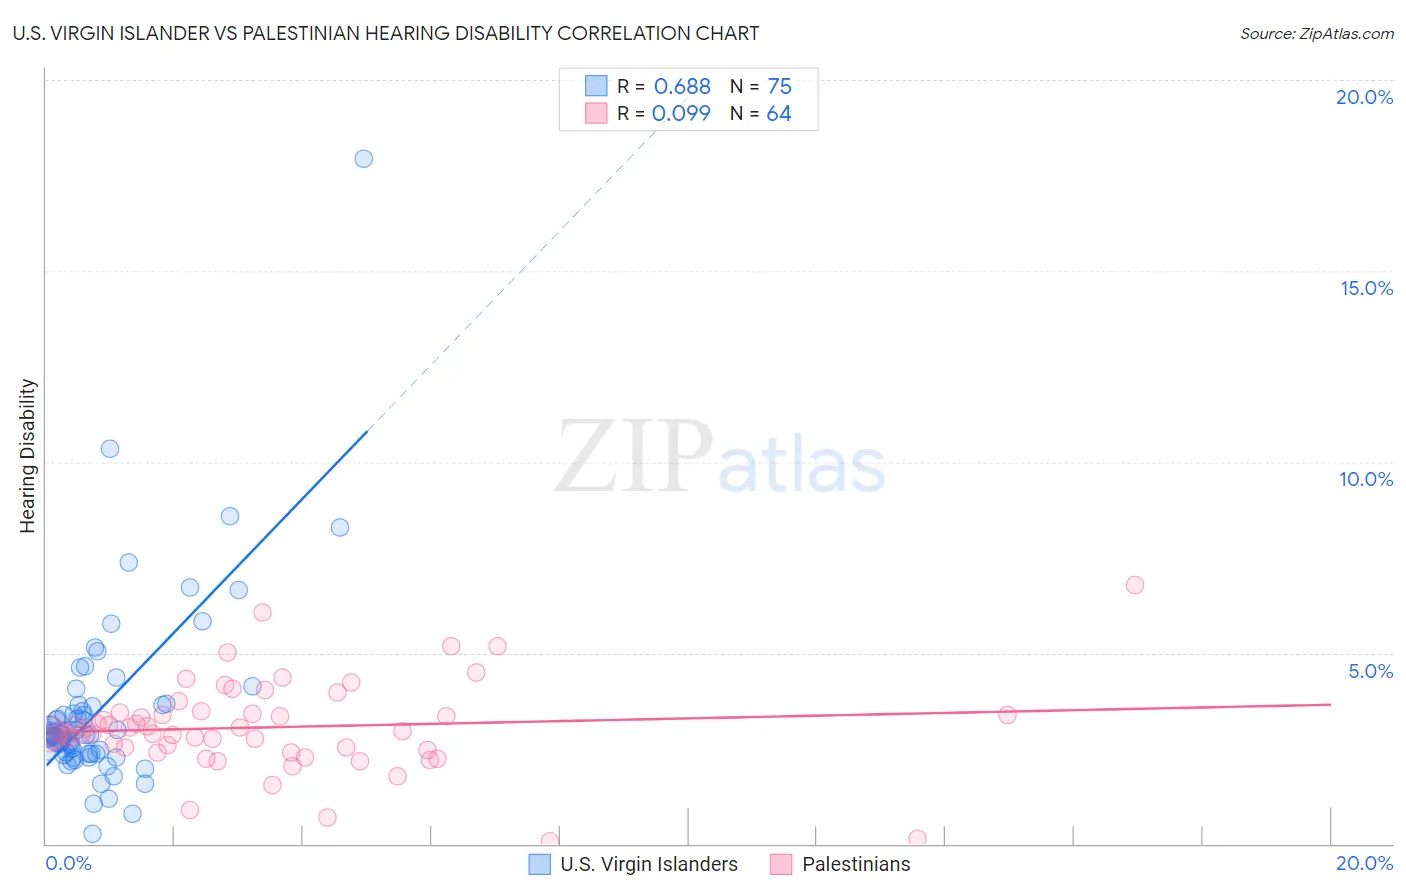
U.S. Virgin Islander vs Palestinian Hearing Disability Correlation Chart
The statistical analysis conducted on geographies consisting of 87,522,963 people shows a significant positive correlation between the proportion of U.S. Virgin Islanders and percentage of population with hearing disability in the United States with a correlation coefficient (R) of 0.688 and weighted average of 2.8%. Similarly, the statistical analysis conducted on geographies consisting of 216,454,064 people shows a slight positive correlation between the proportion of Palestinians and percentage of population with hearing disability in the United States with a correlation coefficient (R) of 0.099 and weighted average of 2.9%, a difference of 3.7%.
Hearing Disability Correlation Summary
| Measurement | U.S. Virgin Islander | Palestinian |
| Minimum | 0.26% | 0.070% |
| Maximum | 17.9% | 6.8% |
| Range | 17.7% | 6.7% |
| Mean | 3.5% | 3.0% |
| Median | 2.9% | 2.9% |
| Interquartile 25% (IQ1) | 2.4% | 2.5% |
| Interquartile 75% (IQ3) | 3.6% | 3.4% |
| Interquartile Range (IQR) | 1.3% | 0.93% |
| Standard Deviation (Sample) | 2.4% | 1.2% |
| Standard Deviation (Population) | 2.4% | 1.2% |
Similar Demographics by Hearing Disability
Demographics Similar to U.S. Virgin Islanders by Hearing Disability
In terms of hearing disability, the demographic groups most similar to U.S. Virgin Islanders are Immigrants from Yemen (2.8%, a difference of 0.070%), Cypriot (2.8%, a difference of 0.12%), Turkish (2.8%, a difference of 0.17%), Guatemalan (2.8%, a difference of 0.24%), and Immigrants from Belarus (2.8%, a difference of 0.31%).
| Demographics | Rating | Rank | Hearing Disability |
| Moroccans | 93.9 /100 | #105 | Exceptional 2.8% |
| Hondurans | 93.4 /100 | #106 | Exceptional 2.8% |
| Immigrants | Chile | 93.4 /100 | #107 | Exceptional 2.8% |
| Guatemalans | 93.2 /100 | #108 | Exceptional 2.8% |
| Turks | 93.0 /100 | #109 | Exceptional 2.8% |
| Cypriots | 92.9 /100 | #110 | Exceptional 2.8% |
| Immigrants | Yemen | 92.7 /100 | #111 | Exceptional 2.8% |
| U.S. Virgin Islanders | 92.5 /100 | #112 | Exceptional 2.8% |
| Immigrants | Belarus | 91.6 /100 | #113 | Exceptional 2.8% |
| Cambodians | 91.1 /100 | #114 | Exceptional 2.8% |
| Immigrants | Latin America | 90.5 /100 | #115 | Exceptional 2.8% |
| Immigrants | Immigrants | 90.3 /100 | #116 | Exceptional 2.8% |
| Immigrants | Liberia | 90.0 /100 | #117 | Excellent 2.8% |
| Zimbabweans | 89.9 /100 | #118 | Excellent 2.8% |
| Kenyans | 89.8 /100 | #119 | Excellent 2.8% |
Demographics Similar to Palestinians by Hearing Disability
In terms of hearing disability, the demographic groups most similar to Palestinians are Immigrants from France (2.9%, a difference of 0.060%), Immigrants from Lithuania (2.9%, a difference of 0.070%), Sudanese (2.9%, a difference of 0.18%), Immigrants from Lebanon (2.9%, a difference of 0.25%), and Costa Rican (2.9%, a difference of 0.27%).
| Demographics | Rating | Rank | Hearing Disability |
| Immigrants | Bahamas | 80.9 /100 | #143 | Excellent 2.9% |
| Immigrants | Bulgaria | 79.2 /100 | #144 | Good 2.9% |
| Immigrants | Congo | 78.9 /100 | #145 | Good 2.9% |
| Brazilians | 78.7 /100 | #146 | Good 2.9% |
| Tongans | 78.6 /100 | #147 | Good 2.9% |
| Immigrants | Russia | 77.7 /100 | #148 | Good 2.9% |
| Immigrants | Panama | 76.9 /100 | #149 | Good 2.9% |
| Palestinians | 73.6 /100 | #150 | Good 2.9% |
| Immigrants | France | 73.1 /100 | #151 | Good 2.9% |
| Immigrants | Lithuania | 73.0 /100 | #152 | Good 2.9% |
| Sudanese | 72.1 /100 | #153 | Good 2.9% |
| Immigrants | Lebanon | 71.5 /100 | #154 | Good 2.9% |
| Costa Ricans | 71.4 /100 | #155 | Good 2.9% |
| Immigrants | Poland | 70.2 /100 | #156 | Good 2.9% |
| Immigrants | Kazakhstan | 69.6 /100 | #157 | Good 2.9% |