Uruguayan vs Comanche Disability Age Under 5
COMPARE
Uruguayan
Comanche
Disability Age Under 5
Disability Age Under 5 Comparison
Uruguayans
Comanche
1.2%
DISABILITY AGE UNDER 5
68.8/ 100
METRIC RATING
154th/ 347
METRIC RANK
1.2%
DISABILITY AGE UNDER 5
47.5/ 100
METRIC RATING
177th/ 347
METRIC RANK
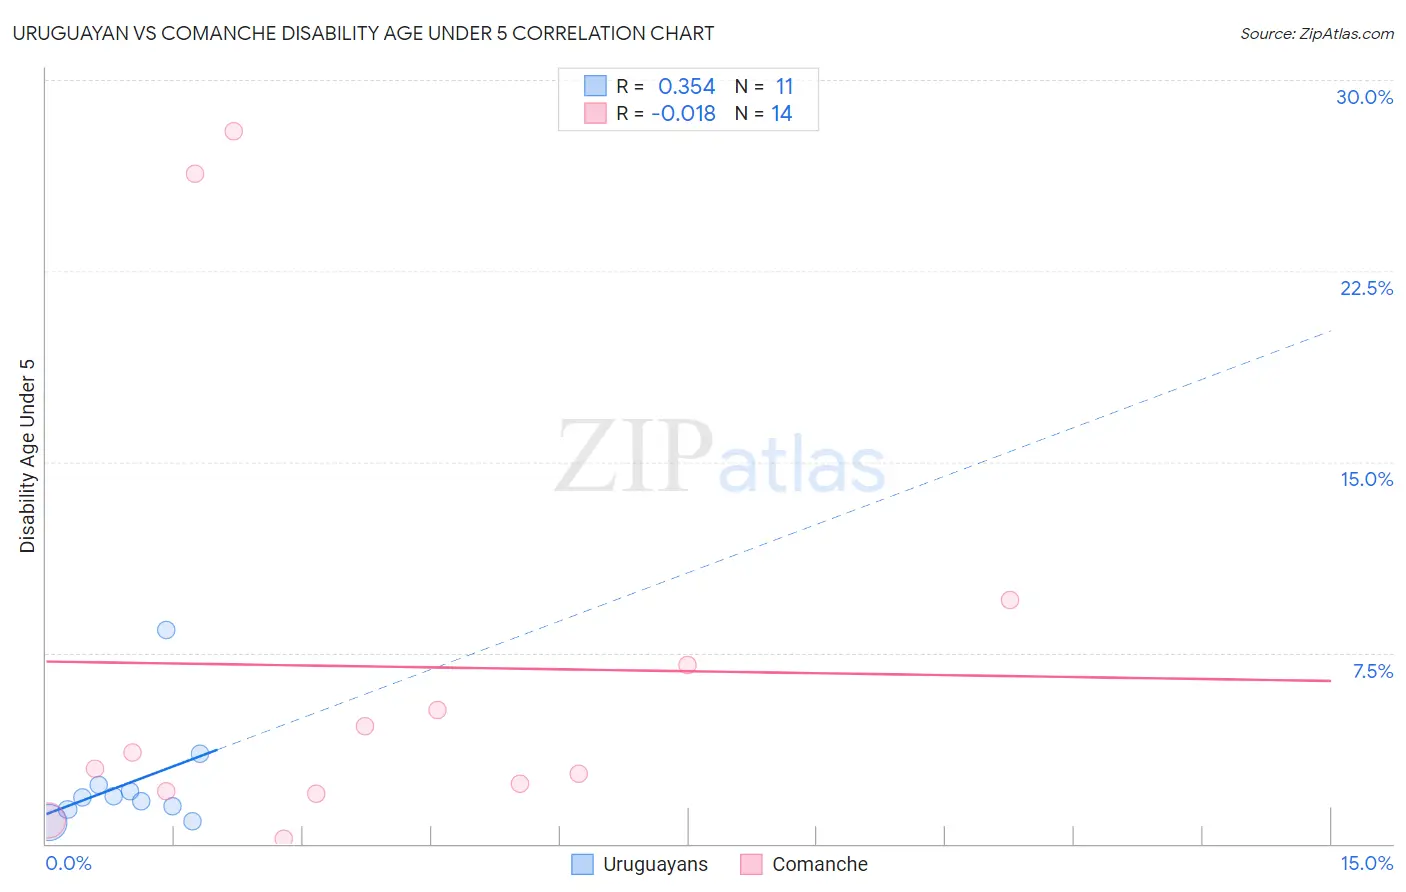
Uruguayan vs Comanche Disability Age Under 5 Correlation Chart
The statistical analysis conducted on geographies consisting of 100,557,895 people shows a mild positive correlation between the proportion of Uruguayans and percentage of population with a disability under the age of 5 in the United States with a correlation coefficient (R) of 0.354 and weighted average of 1.2%. Similarly, the statistical analysis conducted on geographies consisting of 83,999,768 people shows no correlation between the proportion of Comanche and percentage of population with a disability under the age of 5 in the United States with a correlation coefficient (R) of -0.018 and weighted average of 1.2%, a difference of 2.0%.
Disability Age Under 5 Correlation Summary
| Measurement | Uruguayan | Comanche |
| Minimum | 0.85% | 0.20% |
| Maximum | 8.4% | 28.0% |
| Range | 7.6% | 27.8% |
| Mean | 2.4% | 7.0% |
| Median | 1.8% | 3.3% |
| Interquartile 25% (IQ1) | 1.3% | 2.0% |
| Interquartile 75% (IQ3) | 2.3% | 7.0% |
| Interquartile Range (IQR) | 0.97% | 5.0% |
| Standard Deviation (Sample) | 2.1% | 8.9% |
| Standard Deviation (Population) | 2.0% | 8.6% |
Similar Demographics by Disability Age Under 5
Demographics Similar to Uruguayans by Disability Age Under 5
In terms of disability age under 5, the demographic groups most similar to Uruguayans are Immigrants from Ghana (1.2%, a difference of 0.010%), Hawaiian (1.2%, a difference of 0.030%), Immigrants from Thailand (1.2%, a difference of 0.070%), Immigrants from South America (1.2%, a difference of 0.19%), and Arab (1.2%, a difference of 0.25%).
| Demographics | Rating | Rank | Disability Age Under 5 |
| Icelanders | 76.3 /100 | #147 | Good 1.2% |
| Ghanaians | 76.3 /100 | #148 | Good 1.2% |
| Kenyans | 75.9 /100 | #149 | Good 1.2% |
| South Americans | 75.6 /100 | #150 | Good 1.2% |
| Yaqui | 74.8 /100 | #151 | Good 1.2% |
| Hondurans | 72.5 /100 | #152 | Good 1.2% |
| Immigrants | Thailand | 69.4 /100 | #153 | Good 1.2% |
| Uruguayans | 68.8 /100 | #154 | Good 1.2% |
| Immigrants | Ghana | 68.7 /100 | #155 | Good 1.2% |
| Hawaiians | 68.5 /100 | #156 | Good 1.2% |
| Immigrants | South America | 67.0 /100 | #157 | Good 1.2% |
| Arabs | 66.4 /100 | #158 | Good 1.2% |
| Colombians | 65.8 /100 | #159 | Good 1.2% |
| Immigrants | Latin America | 65.8 /100 | #160 | Good 1.2% |
| Immigrants | Africa | 65.1 /100 | #161 | Good 1.2% |
Demographics Similar to Comanche by Disability Age Under 5
In terms of disability age under 5, the demographic groups most similar to Comanche are Venezuelan (1.2%, a difference of 0.040%), Immigrants from Kenya (1.2%, a difference of 0.090%), Immigrants from Bahamas (1.2%, a difference of 0.21%), Immigrants from Latvia (1.2%, a difference of 0.22%), and Immigrants from Nigeria (1.2%, a difference of 0.22%).
| Demographics | Rating | Rank | Disability Age Under 5 |
| Immigrants | Jamaica | 58.8 /100 | #170 | Average 1.2% |
| Guamanians/Chamorros | 57.8 /100 | #171 | Average 1.2% |
| Crow | 51.0 /100 | #172 | Average 1.2% |
| Immigrants | Ireland | 50.3 /100 | #173 | Average 1.2% |
| Immigrants | Latvia | 50.0 /100 | #174 | Average 1.2% |
| Immigrants | Nigeria | 50.0 /100 | #175 | Average 1.2% |
| Immigrants | Kenya | 48.6 /100 | #176 | Average 1.2% |
| Comanche | 47.5 /100 | #177 | Average 1.2% |
| Venezuelans | 47.1 /100 | #178 | Average 1.2% |
| Immigrants | Bahamas | 45.2 /100 | #179 | Average 1.2% |
| Immigrants | Mexico | 44.4 /100 | #180 | Average 1.2% |
| Immigrants | Peru | 43.7 /100 | #181 | Average 1.2% |
| Macedonians | 43.7 /100 | #181 | Average 1.2% |
| Immigrants | Saudi Arabia | 43.3 /100 | #183 | Average 1.2% |
| Palestinians | 43.0 /100 | #184 | Average 1.2% |