Immigrants from Western Africa vs Comanche Disability Age Under 5
COMPARE
Immigrants from Western Africa
Comanche
Disability Age Under 5
Disability Age Under 5 Comparison
Immigrants from Western Africa
Comanche
1.2%
DISABILITY AGE UNDER 5
42.5/ 100
METRIC RATING
185th/ 347
METRIC RANK
1.2%
DISABILITY AGE UNDER 5
47.5/ 100
METRIC RATING
177th/ 347
METRIC RANK
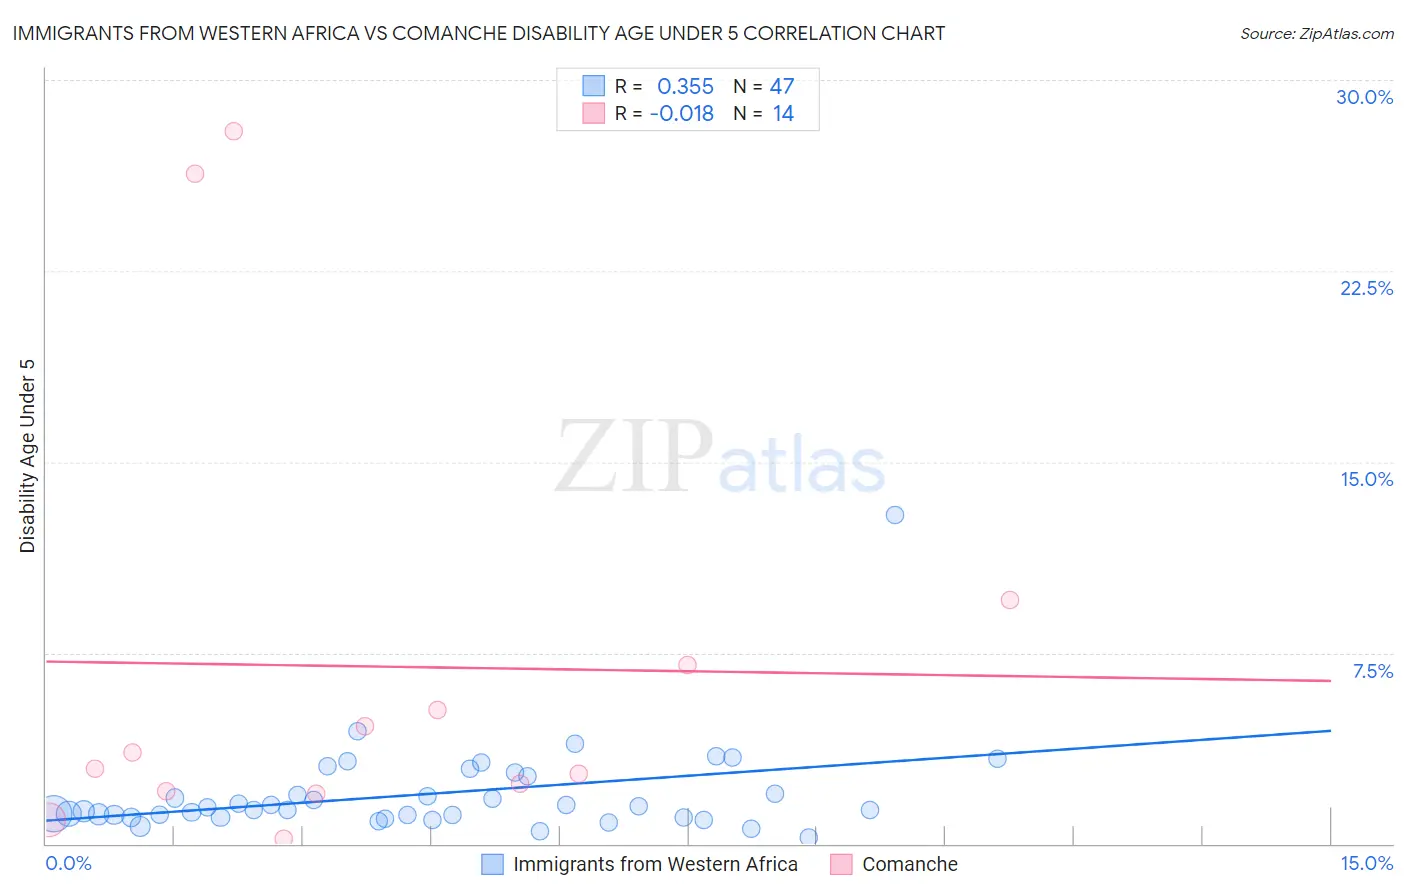
Immigrants from Western Africa vs Comanche Disability Age Under 5 Correlation Chart
The statistical analysis conducted on geographies consisting of 204,229,476 people shows a mild positive correlation between the proportion of Immigrants from Western Africa and percentage of population with a disability under the age of 5 in the United States with a correlation coefficient (R) of 0.355 and weighted average of 1.2%. Similarly, the statistical analysis conducted on geographies consisting of 83,999,768 people shows no correlation between the proportion of Comanche and percentage of population with a disability under the age of 5 in the United States with a correlation coefficient (R) of -0.018 and weighted average of 1.2%, a difference of 0.46%.
Disability Age Under 5 Correlation Summary
| Measurement | Immigrants from Western Africa | Comanche |
| Minimum | 0.22% | 0.20% |
| Maximum | 12.9% | 28.0% |
| Range | 12.7% | 27.8% |
| Mean | 2.0% | 7.0% |
| Median | 1.3% | 3.3% |
| Interquartile 25% (IQ1) | 1.0% | 2.0% |
| Interquartile 75% (IQ3) | 2.7% | 7.0% |
| Interquartile Range (IQR) | 1.6% | 5.0% |
| Standard Deviation (Sample) | 1.9% | 8.9% |
| Standard Deviation (Population) | 1.9% | 8.6% |
Demographics Similar to Immigrants from Western Africa and Comanche by Disability Age Under 5
In terms of disability age under 5, the demographic groups most similar to Immigrants from Western Africa are Cuban (1.2%, a difference of 0.0%), Palestinian (1.2%, a difference of 0.050%), Immigrants from Saudi Arabia (1.2%, a difference of 0.070%), Macedonian (1.2%, a difference of 0.11%), and Immigrants from Peru (1.2%, a difference of 0.11%). Similarly, the demographic groups most similar to Comanche are Venezuelan (1.2%, a difference of 0.040%), Immigrants from Kenya (1.2%, a difference of 0.090%), Immigrants from Bahamas (1.2%, a difference of 0.21%), Immigrants from Latvia (1.2%, a difference of 0.22%), and Immigrants from Nigeria (1.2%, a difference of 0.22%).
| Demographics | Rating | Rank | Disability Age Under 5 |
| Guamanians/Chamorros | 57.8 /100 | #171 | Average 1.2% |
| Crow | 51.0 /100 | #172 | Average 1.2% |
| Immigrants | Ireland | 50.3 /100 | #173 | Average 1.2% |
| Immigrants | Latvia | 50.0 /100 | #174 | Average 1.2% |
| Immigrants | Nigeria | 50.0 /100 | #175 | Average 1.2% |
| Immigrants | Kenya | 48.6 /100 | #176 | Average 1.2% |
| Comanche | 47.5 /100 | #177 | Average 1.2% |
| Venezuelans | 47.1 /100 | #178 | Average 1.2% |
| Immigrants | Bahamas | 45.2 /100 | #179 | Average 1.2% |
| Immigrants | Mexico | 44.4 /100 | #180 | Average 1.2% |
| Macedonians | 43.7 /100 | #181 | Average 1.2% |
| Immigrants | Peru | 43.7 /100 | #181 | Average 1.2% |
| Immigrants | Saudi Arabia | 43.3 /100 | #183 | Average 1.2% |
| Palestinians | 43.0 /100 | #184 | Average 1.2% |
| Immigrants | Western Africa | 42.5 /100 | #185 | Average 1.2% |
| Cubans | 42.5 /100 | #186 | Average 1.2% |
| Immigrants | Haiti | 40.2 /100 | #187 | Average 1.3% |
| Haitians | 39.9 /100 | #188 | Fair 1.3% |
| Peruvians | 37.6 /100 | #189 | Fair 1.3% |
| Immigrants | Laos | 36.6 /100 | #190 | Fair 1.3% |
| Mexican American Indians | 36.6 /100 | #191 | Fair 1.3% |