Uruguayan vs Inupiat Disability Age Under 5
COMPARE
Uruguayan
Inupiat
Disability Age Under 5
Disability Age Under 5 Comparison
Uruguayans
Inupiat
1.2%
DISABILITY AGE UNDER 5
68.8/ 100
METRIC RATING
154th/ 347
METRIC RANK
3.7%
DISABILITY AGE UNDER 5
0.0/ 100
METRIC RATING
344th/ 347
METRIC RANK
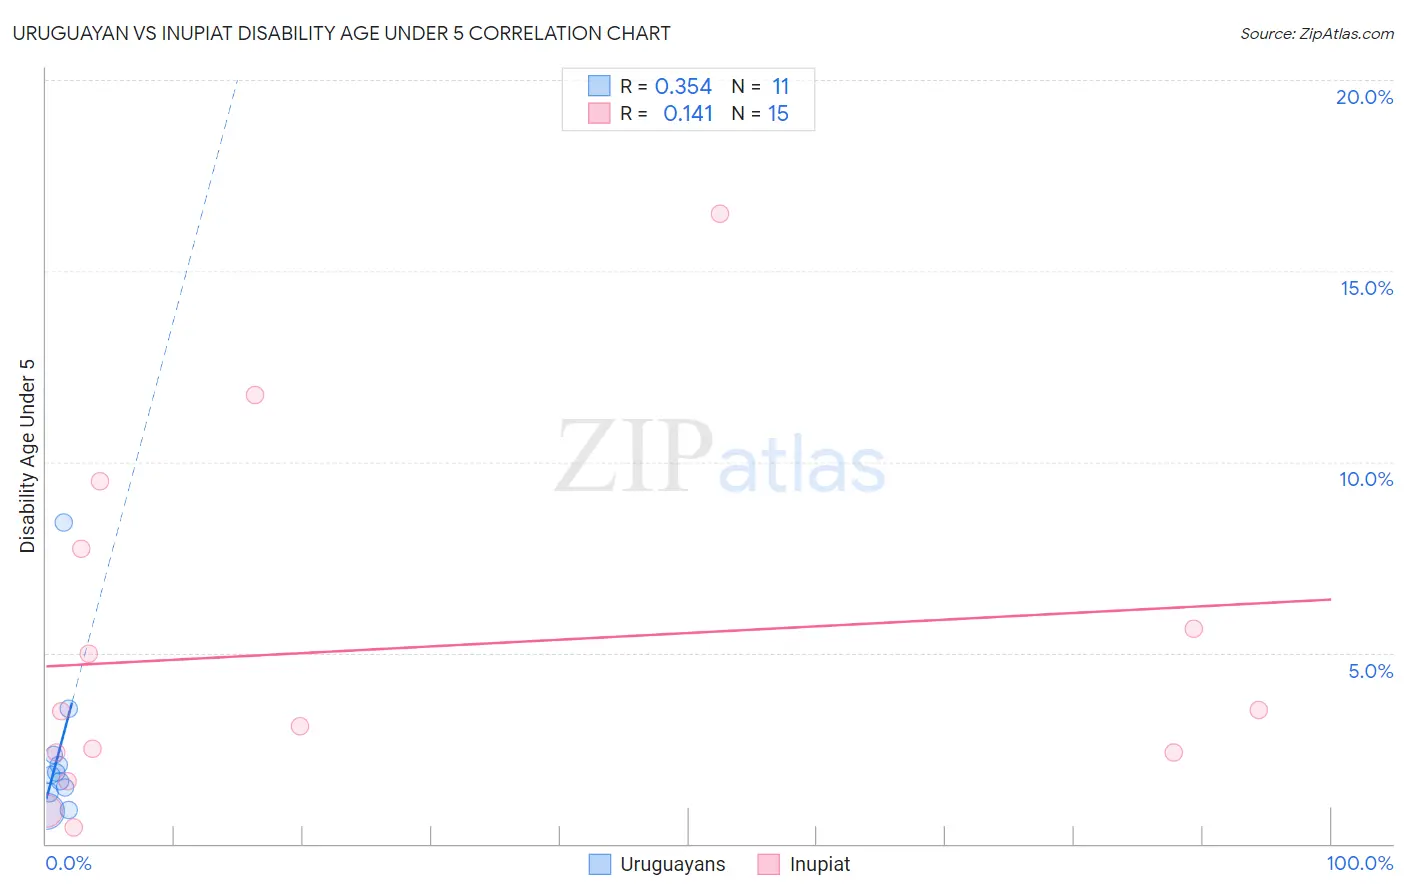
Uruguayan vs Inupiat Disability Age Under 5 Correlation Chart
The statistical analysis conducted on geographies consisting of 100,557,895 people shows a mild positive correlation between the proportion of Uruguayans and percentage of population with a disability under the age of 5 in the United States with a correlation coefficient (R) of 0.354 and weighted average of 1.2%. Similarly, the statistical analysis conducted on geographies consisting of 76,997,061 people shows a poor positive correlation between the proportion of Inupiat and percentage of population with a disability under the age of 5 in the United States with a correlation coefficient (R) of 0.141 and weighted average of 3.7%, a difference of 204.6%.
Disability Age Under 5 Correlation Summary
| Measurement | Uruguayan | Inupiat |
| Minimum | 0.85% | 0.42% |
| Maximum | 8.4% | 16.5% |
| Range | 7.6% | 16.1% |
| Mean | 2.4% | 5.1% |
| Median | 1.8% | 3.5% |
| Interquartile 25% (IQ1) | 1.3% | 2.4% |
| Interquartile 75% (IQ3) | 2.3% | 7.7% |
| Interquartile Range (IQR) | 0.97% | 5.4% |
| Standard Deviation (Sample) | 2.1% | 4.5% |
| Standard Deviation (Population) | 2.0% | 4.4% |
Similar Demographics by Disability Age Under 5
Demographics Similar to Uruguayans by Disability Age Under 5
In terms of disability age under 5, the demographic groups most similar to Uruguayans are Immigrants from Ghana (1.2%, a difference of 0.010%), Hawaiian (1.2%, a difference of 0.030%), Immigrants from Thailand (1.2%, a difference of 0.070%), Immigrants from South America (1.2%, a difference of 0.19%), and Arab (1.2%, a difference of 0.25%).
| Demographics | Rating | Rank | Disability Age Under 5 |
| Icelanders | 76.3 /100 | #147 | Good 1.2% |
| Ghanaians | 76.3 /100 | #148 | Good 1.2% |
| Kenyans | 75.9 /100 | #149 | Good 1.2% |
| South Americans | 75.6 /100 | #150 | Good 1.2% |
| Yaqui | 74.8 /100 | #151 | Good 1.2% |
| Hondurans | 72.5 /100 | #152 | Good 1.2% |
| Immigrants | Thailand | 69.4 /100 | #153 | Good 1.2% |
| Uruguayans | 68.8 /100 | #154 | Good 1.2% |
| Immigrants | Ghana | 68.7 /100 | #155 | Good 1.2% |
| Hawaiians | 68.5 /100 | #156 | Good 1.2% |
| Immigrants | South America | 67.0 /100 | #157 | Good 1.2% |
| Arabs | 66.4 /100 | #158 | Good 1.2% |
| Colombians | 65.8 /100 | #159 | Good 1.2% |
| Immigrants | Latin America | 65.8 /100 | #160 | Good 1.2% |
| Immigrants | Africa | 65.1 /100 | #161 | Good 1.2% |
Demographics Similar to Inupiat by Disability Age Under 5
In terms of disability age under 5, the demographic groups most similar to Inupiat are Paiute (3.9%, a difference of 5.3%), Colville (3.3%, a difference of 13.0%), Yup'ik (4.5%, a difference of 22.0%), Hopi (4.6%, a difference of 24.8%), and Alaska Native (2.9%, a difference of 26.1%).
| Demographics | Rating | Rank | Disability Age Under 5 |
| Dutch West Indians | 0.0 /100 | #333 | Tragic 1.9% |
| Natives/Alaskans | 0.0 /100 | #334 | Tragic 1.9% |
| Pennsylvania Germans | 0.0 /100 | #335 | Tragic 1.9% |
| Paraguayans | 0.0 /100 | #336 | Tragic 2.0% |
| Apache | 0.0 /100 | #337 | Tragic 2.0% |
| Tohono O'odham | 0.0 /100 | #338 | Tragic 2.2% |
| Immigrants | Azores | 0.0 /100 | #339 | Tragic 2.2% |
| Menominee | 0.0 /100 | #340 | Tragic 2.3% |
| Tsimshian | 0.0 /100 | #341 | Tragic 2.4% |
| Alaska Natives | 0.0 /100 | #342 | Tragic 2.9% |
| Colville | 0.0 /100 | #343 | Tragic 3.3% |
| Inupiat | 0.0 /100 | #344 | Tragic 3.7% |
| Paiute | 0.0 /100 | #345 | Tragic 3.9% |
| Yup'ik | 0.0 /100 | #346 | Tragic 4.5% |
| Hopi | 0.0 /100 | #347 | Tragic 4.6% |