Uruguayan vs Comanche 5th Grade
COMPARE
Uruguayan
Comanche
5th Grade
5th Grade Comparison
Uruguayans
Comanche
97.0%
5TH GRADE
3.2/ 100
METRIC RATING
235th/ 347
METRIC RANK
97.3%
5TH GRADE
42.1/ 100
METRIC RATING
178th/ 347
METRIC RANK
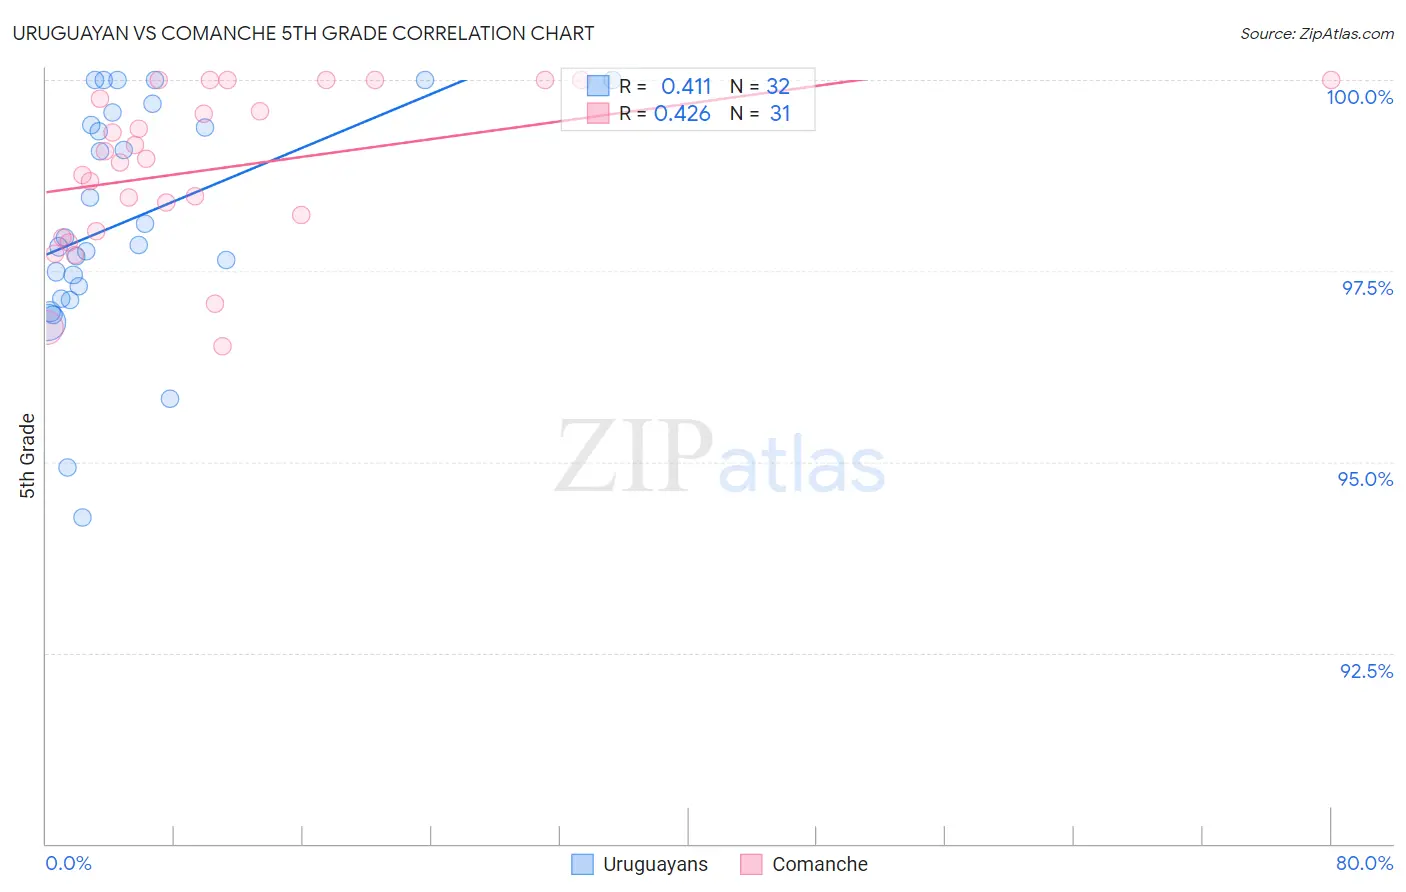
Uruguayan vs Comanche 5th Grade Correlation Chart
The statistical analysis conducted on geographies consisting of 144,782,794 people shows a moderate positive correlation between the proportion of Uruguayans and percentage of population with at least 5th grade education in the United States with a correlation coefficient (R) of 0.411 and weighted average of 97.0%. Similarly, the statistical analysis conducted on geographies consisting of 109,786,530 people shows a moderate positive correlation between the proportion of Comanche and percentage of population with at least 5th grade education in the United States with a correlation coefficient (R) of 0.426 and weighted average of 97.3%, a difference of 0.32%.
5th Grade Correlation Summary
| Measurement | Uruguayan | Comanche |
| Minimum | 94.3% | 96.5% |
| Maximum | 100.0% | 100.0% |
| Range | 5.7% | 3.5% |
| Mean | 98.2% | 98.8% |
| Median | 97.9% | 99.0% |
| Interquartile 25% (IQ1) | 97.2% | 98.0% |
| Interquartile 75% (IQ3) | 99.5% | 100.0% |
| Interquartile Range (IQR) | 2.3% | 2.0% |
| Standard Deviation (Sample) | 1.5% | 1.0% |
| Standard Deviation (Population) | 1.5% | 1.0% |
Similar Demographics by 5th Grade
Demographics Similar to Uruguayans by 5th Grade
In terms of 5th grade, the demographic groups most similar to Uruguayans are Subsaharan African (97.0%, a difference of 0.0%), Tohono O'odham (97.0%, a difference of 0.0%), Immigrants from Eastern Asia (97.0%, a difference of 0.020%), Senegalese (97.0%, a difference of 0.020%), and Immigrants from Western Asia (97.0%, a difference of 0.030%).
| Demographics | Rating | Rank | 5th Grade |
| Assyrians/Chaldeans/Syriacs | 4.5 /100 | #228 | Tragic 97.0% |
| Yuman | 4.5 /100 | #229 | Tragic 97.0% |
| Immigrants | Western Asia | 4.3 /100 | #230 | Tragic 97.0% |
| Immigrants | Malaysia | 4.1 /100 | #231 | Tragic 97.0% |
| Immigrants | Eastern Asia | 4.0 /100 | #232 | Tragic 97.0% |
| Sub-Saharan Africans | 3.3 /100 | #233 | Tragic 97.0% |
| Tohono O'odham | 3.2 /100 | #234 | Tragic 97.0% |
| Uruguayans | 3.2 /100 | #235 | Tragic 97.0% |
| Senegalese | 2.8 /100 | #236 | Tragic 97.0% |
| Immigrants | Indonesia | 2.0 /100 | #237 | Tragic 96.9% |
| Asians | 2.0 /100 | #238 | Tragic 96.9% |
| Nigerians | 1.9 /100 | #239 | Tragic 96.9% |
| Indians (Asian) | 1.9 /100 | #240 | Tragic 96.9% |
| Immigrants | Asia | 1.7 /100 | #241 | Tragic 96.9% |
| Immigrants | Costa Rica | 1.6 /100 | #242 | Tragic 96.9% |
Demographics Similar to Comanche by 5th Grade
In terms of 5th grade, the demographic groups most similar to Comanche are Immigrants from Kenya (97.3%, a difference of 0.010%), Pakistani (97.3%, a difference of 0.010%), Argentinean (97.3%, a difference of 0.010%), Mongolian (97.3%, a difference of 0.010%), and Immigrants from Spain (97.3%, a difference of 0.020%).
| Demographics | Rating | Rank | 5th Grade |
| Immigrants | Sri Lanka | 53.8 /100 | #171 | Average 97.3% |
| Arabs | 53.4 /100 | #172 | Average 97.3% |
| Egyptians | 52.4 /100 | #173 | Average 97.3% |
| Immigrants | Kazakhstan | 50.0 /100 | #174 | Average 97.3% |
| Immigrants | Micronesia | 48.8 /100 | #175 | Average 97.3% |
| Immigrants | Taiwan | 48.4 /100 | #176 | Average 97.3% |
| Immigrants | Spain | 47.0 /100 | #177 | Average 97.3% |
| Comanche | 42.1 /100 | #178 | Average 97.3% |
| Immigrants | Kenya | 40.3 /100 | #179 | Average 97.3% |
| Pakistanis | 40.2 /100 | #180 | Average 97.3% |
| Argentineans | 39.5 /100 | #181 | Fair 97.3% |
| Mongolians | 39.4 /100 | #182 | Fair 97.3% |
| Immigrants | Ukraine | 38.6 /100 | #183 | Fair 97.3% |
| Immigrants | Venezuela | 38.4 /100 | #184 | Fair 97.3% |
| Dutch West Indians | 36.2 /100 | #185 | Fair 97.3% |