Soviet Union vs Comanche Disability Age Under 5
COMPARE
Soviet Union
Comanche
Disability Age Under 5
Disability Age Under 5 Comparison
Soviet Union
Comanche
0.95%
DISABILITY AGE UNDER 5
100.0/ 100
METRIC RATING
13th/ 347
METRIC RANK
1.2%
DISABILITY AGE UNDER 5
47.5/ 100
METRIC RATING
177th/ 347
METRIC RANK
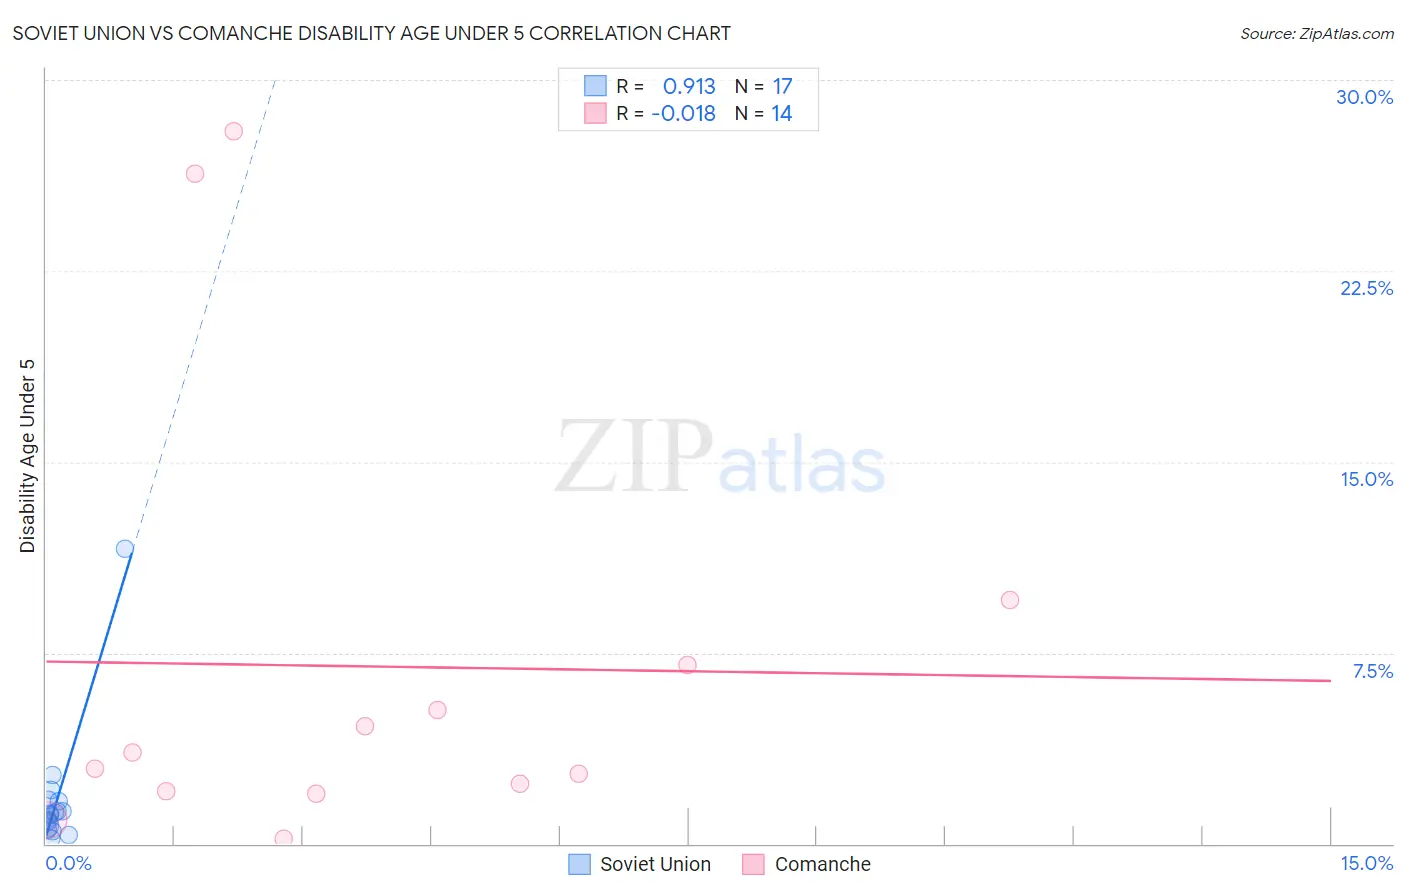
Soviet Union vs Comanche Disability Age Under 5 Correlation Chart
The statistical analysis conducted on geographies consisting of 37,806,626 people shows a near-perfect positive correlation between the proportion of Soviet Union and percentage of population with a disability under the age of 5 in the United States with a correlation coefficient (R) of 0.913 and weighted average of 0.95%. Similarly, the statistical analysis conducted on geographies consisting of 83,999,768 people shows no correlation between the proportion of Comanche and percentage of population with a disability under the age of 5 in the United States with a correlation coefficient (R) of -0.018 and weighted average of 1.2%, a difference of 31.4%.
Disability Age Under 5 Correlation Summary
| Measurement | Soviet Union | Comanche |
| Minimum | 0.19% | 0.20% |
| Maximum | 11.6% | 28.0% |
| Range | 11.4% | 27.8% |
| Mean | 1.8% | 7.0% |
| Median | 1.2% | 3.3% |
| Interquartile 25% (IQ1) | 0.64% | 2.0% |
| Interquartile 75% (IQ3) | 1.7% | 7.0% |
| Interquartile Range (IQR) | 1.0% | 5.0% |
| Standard Deviation (Sample) | 2.6% | 8.9% |
| Standard Deviation (Population) | 2.5% | 8.6% |
Similar Demographics by Disability Age Under 5
Demographics Similar to Soviet Union by Disability Age Under 5
In terms of disability age under 5, the demographic groups most similar to Soviet Union are Yuman (0.95%, a difference of 0.080%), Immigrants from Hong Kong (0.95%, a difference of 0.11%), Immigrants from Grenada (0.94%, a difference of 0.17%), Afghan (0.94%, a difference of 0.19%), and Marshallese (0.94%, a difference of 0.95%).
| Demographics | Rating | Rank | Disability Age Under 5 |
| Ute | 100.0 /100 | #6 | Exceptional 0.86% |
| Immigrants | Afghanistan | 100.0 /100 | #7 | Exceptional 0.91% |
| Immigrants | Yemen | 100.0 /100 | #8 | Exceptional 0.91% |
| Immigrants | Fiji | 100.0 /100 | #9 | Exceptional 0.92% |
| Marshallese | 100.0 /100 | #10 | Exceptional 0.94% |
| Afghans | 100.0 /100 | #11 | Exceptional 0.94% |
| Immigrants | Grenada | 100.0 /100 | #12 | Exceptional 0.94% |
| Soviet Union | 100.0 /100 | #13 | Exceptional 0.95% |
| Yuman | 100.0 /100 | #14 | Exceptional 0.95% |
| Immigrants | Hong Kong | 100.0 /100 | #15 | Exceptional 0.95% |
| Immigrants | Israel | 100.0 /100 | #16 | Exceptional 0.96% |
| Immigrants | China | 100.0 /100 | #17 | Exceptional 0.96% |
| Immigrants | Barbados | 100.0 /100 | #18 | Exceptional 0.97% |
| Puget Sound Salish | 100.0 /100 | #19 | Exceptional 0.97% |
| Nepalese | 100.0 /100 | #20 | Exceptional 0.97% |
Demographics Similar to Comanche by Disability Age Under 5
In terms of disability age under 5, the demographic groups most similar to Comanche are Venezuelan (1.2%, a difference of 0.040%), Immigrants from Kenya (1.2%, a difference of 0.090%), Immigrants from Bahamas (1.2%, a difference of 0.21%), Immigrants from Latvia (1.2%, a difference of 0.22%), and Immigrants from Nigeria (1.2%, a difference of 0.22%).
| Demographics | Rating | Rank | Disability Age Under 5 |
| Immigrants | Jamaica | 58.8 /100 | #170 | Average 1.2% |
| Guamanians/Chamorros | 57.8 /100 | #171 | Average 1.2% |
| Crow | 51.0 /100 | #172 | Average 1.2% |
| Immigrants | Ireland | 50.3 /100 | #173 | Average 1.2% |
| Immigrants | Latvia | 50.0 /100 | #174 | Average 1.2% |
| Immigrants | Nigeria | 50.0 /100 | #175 | Average 1.2% |
| Immigrants | Kenya | 48.6 /100 | #176 | Average 1.2% |
| Comanche | 47.5 /100 | #177 | Average 1.2% |
| Venezuelans | 47.1 /100 | #178 | Average 1.2% |
| Immigrants | Bahamas | 45.2 /100 | #179 | Average 1.2% |
| Immigrants | Mexico | 44.4 /100 | #180 | Average 1.2% |
| Immigrants | Peru | 43.7 /100 | #181 | Average 1.2% |
| Macedonians | 43.7 /100 | #181 | Average 1.2% |
| Immigrants | Saudi Arabia | 43.3 /100 | #183 | Average 1.2% |
| Palestinians | 43.0 /100 | #184 | Average 1.2% |