Uruguayan vs Immigrants from Poland Disability Age Under 5
COMPARE
Uruguayan
Immigrants from Poland
Disability Age Under 5
Disability Age Under 5 Comparison
Uruguayans
Immigrants from Poland
1.2%
DISABILITY AGE UNDER 5
68.8/ 100
METRIC RATING
154th/ 347
METRIC RANK
1.3%
DISABILITY AGE UNDER 5
22.4/ 100
METRIC RATING
206th/ 347
METRIC RANK
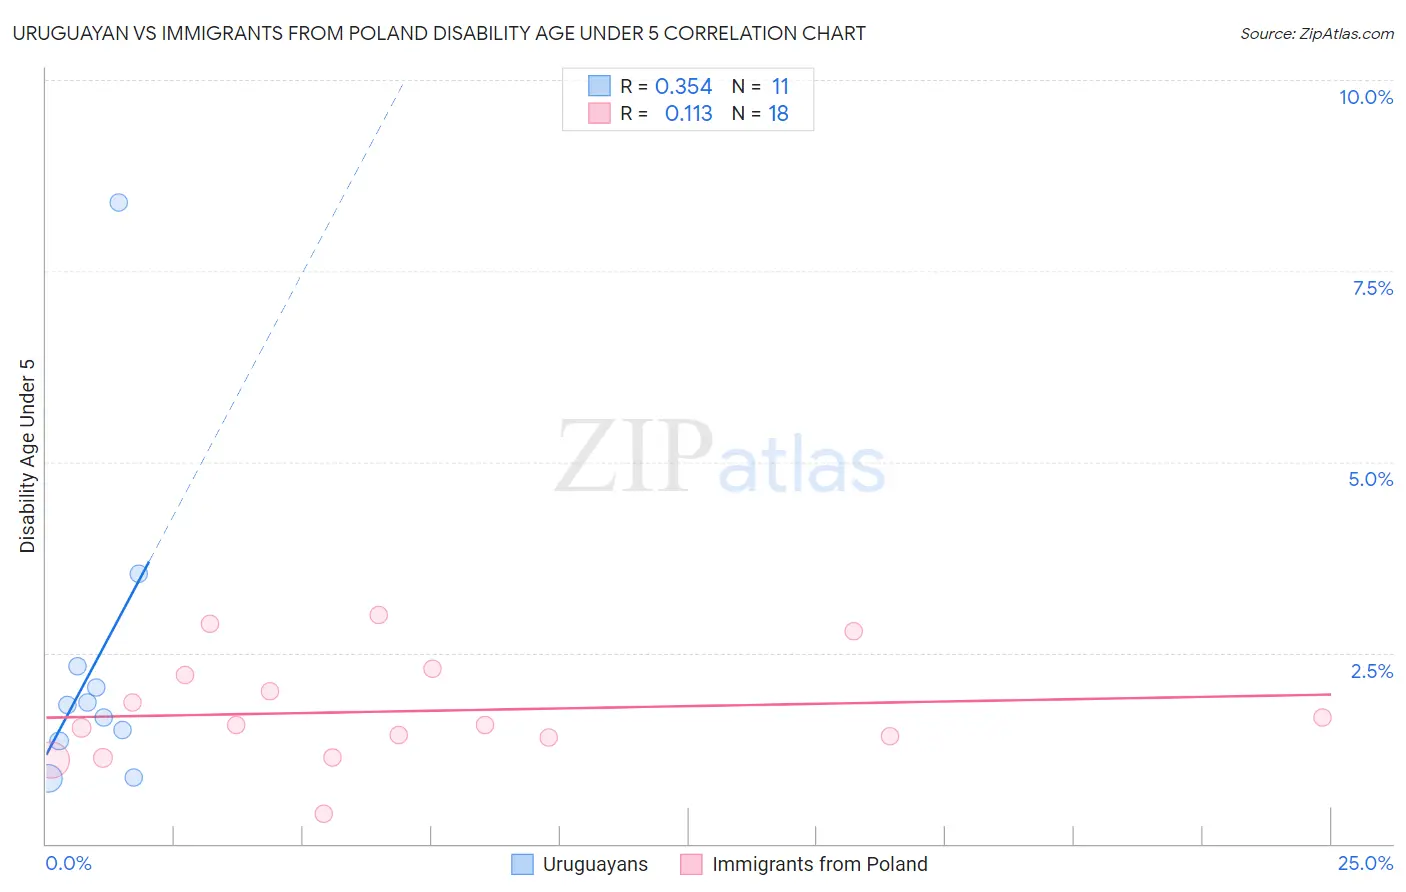
Uruguayan vs Immigrants from Poland Disability Age Under 5 Correlation Chart
The statistical analysis conducted on geographies consisting of 100,557,895 people shows a mild positive correlation between the proportion of Uruguayans and percentage of population with a disability under the age of 5 in the United States with a correlation coefficient (R) of 0.354 and weighted average of 1.2%. Similarly, the statistical analysis conducted on geographies consisting of 173,203,351 people shows a poor positive correlation between the proportion of Immigrants from Poland and percentage of population with a disability under the age of 5 in the United States with a correlation coefficient (R) of 0.113 and weighted average of 1.3%, a difference of 4.7%.
Disability Age Under 5 Correlation Summary
| Measurement | Uruguayan | Immigrants from Poland |
| Minimum | 0.85% | 0.38% |
| Maximum | 8.4% | 3.0% |
| Range | 7.6% | 2.6% |
| Mean | 2.4% | 1.7% |
| Median | 1.8% | 1.6% |
| Interquartile 25% (IQ1) | 1.3% | 1.4% |
| Interquartile 75% (IQ3) | 2.3% | 2.2% |
| Interquartile Range (IQR) | 0.97% | 0.82% |
| Standard Deviation (Sample) | 2.1% | 0.69% |
| Standard Deviation (Population) | 2.0% | 0.67% |
Similar Demographics by Disability Age Under 5
Demographics Similar to Uruguayans by Disability Age Under 5
In terms of disability age under 5, the demographic groups most similar to Uruguayans are Immigrants from Ghana (1.2%, a difference of 0.010%), Hawaiian (1.2%, a difference of 0.030%), Immigrants from Thailand (1.2%, a difference of 0.070%), Immigrants from South America (1.2%, a difference of 0.19%), and Arab (1.2%, a difference of 0.25%).
| Demographics | Rating | Rank | Disability Age Under 5 |
| Icelanders | 76.3 /100 | #147 | Good 1.2% |
| Ghanaians | 76.3 /100 | #148 | Good 1.2% |
| Kenyans | 75.9 /100 | #149 | Good 1.2% |
| South Americans | 75.6 /100 | #150 | Good 1.2% |
| Yaqui | 74.8 /100 | #151 | Good 1.2% |
| Hondurans | 72.5 /100 | #152 | Good 1.2% |
| Immigrants | Thailand | 69.4 /100 | #153 | Good 1.2% |
| Uruguayans | 68.8 /100 | #154 | Good 1.2% |
| Immigrants | Ghana | 68.7 /100 | #155 | Good 1.2% |
| Hawaiians | 68.5 /100 | #156 | Good 1.2% |
| Immigrants | South America | 67.0 /100 | #157 | Good 1.2% |
| Arabs | 66.4 /100 | #158 | Good 1.2% |
| Colombians | 65.8 /100 | #159 | Good 1.2% |
| Immigrants | Latin America | 65.8 /100 | #160 | Good 1.2% |
| Immigrants | Africa | 65.1 /100 | #161 | Good 1.2% |
Demographics Similar to Immigrants from Poland by Disability Age Under 5
In terms of disability age under 5, the demographic groups most similar to Immigrants from Poland are Romanian (1.3%, a difference of 0.020%), Nigerian (1.3%, a difference of 0.15%), Immigrants from Europe (1.3%, a difference of 0.16%), Liberian (1.3%, a difference of 0.20%), and Mexican (1.3%, a difference of 0.21%).
| Demographics | Rating | Rank | Disability Age Under 5 |
| Jamaicans | 30.7 /100 | #199 | Fair 1.3% |
| Immigrants | Lithuania | 27.2 /100 | #200 | Fair 1.3% |
| Immigrants | Italy | 25.4 /100 | #201 | Fair 1.3% |
| Arapaho | 24.1 /100 | #202 | Fair 1.3% |
| Liberians | 24.0 /100 | #203 | Fair 1.3% |
| Immigrants | Europe | 23.6 /100 | #204 | Fair 1.3% |
| Romanians | 22.5 /100 | #205 | Fair 1.3% |
| Immigrants | Poland | 22.4 /100 | #206 | Fair 1.3% |
| Nigerians | 21.2 /100 | #207 | Fair 1.3% |
| Mexicans | 20.8 /100 | #208 | Fair 1.3% |
| Bulgarians | 19.5 /100 | #209 | Poor 1.3% |
| Pakistanis | 19.4 /100 | #210 | Poor 1.3% |
| Immigrants | Greece | 19.1 /100 | #211 | Poor 1.3% |
| Chileans | 18.8 /100 | #212 | Poor 1.3% |
| Immigrants | Sudan | 18.7 /100 | #213 | Poor 1.3% |