Immigrants from Northern Europe vs Comanche Disability Age Under 5
COMPARE
Immigrants from Northern Europe
Comanche
Disability Age Under 5
Disability Age Under 5 Comparison
Immigrants from Northern Europe
Comanche
1.3%
DISABILITY AGE UNDER 5
4.7/ 100
METRIC RATING
231st/ 347
METRIC RANK
1.2%
DISABILITY AGE UNDER 5
47.5/ 100
METRIC RATING
177th/ 347
METRIC RANK
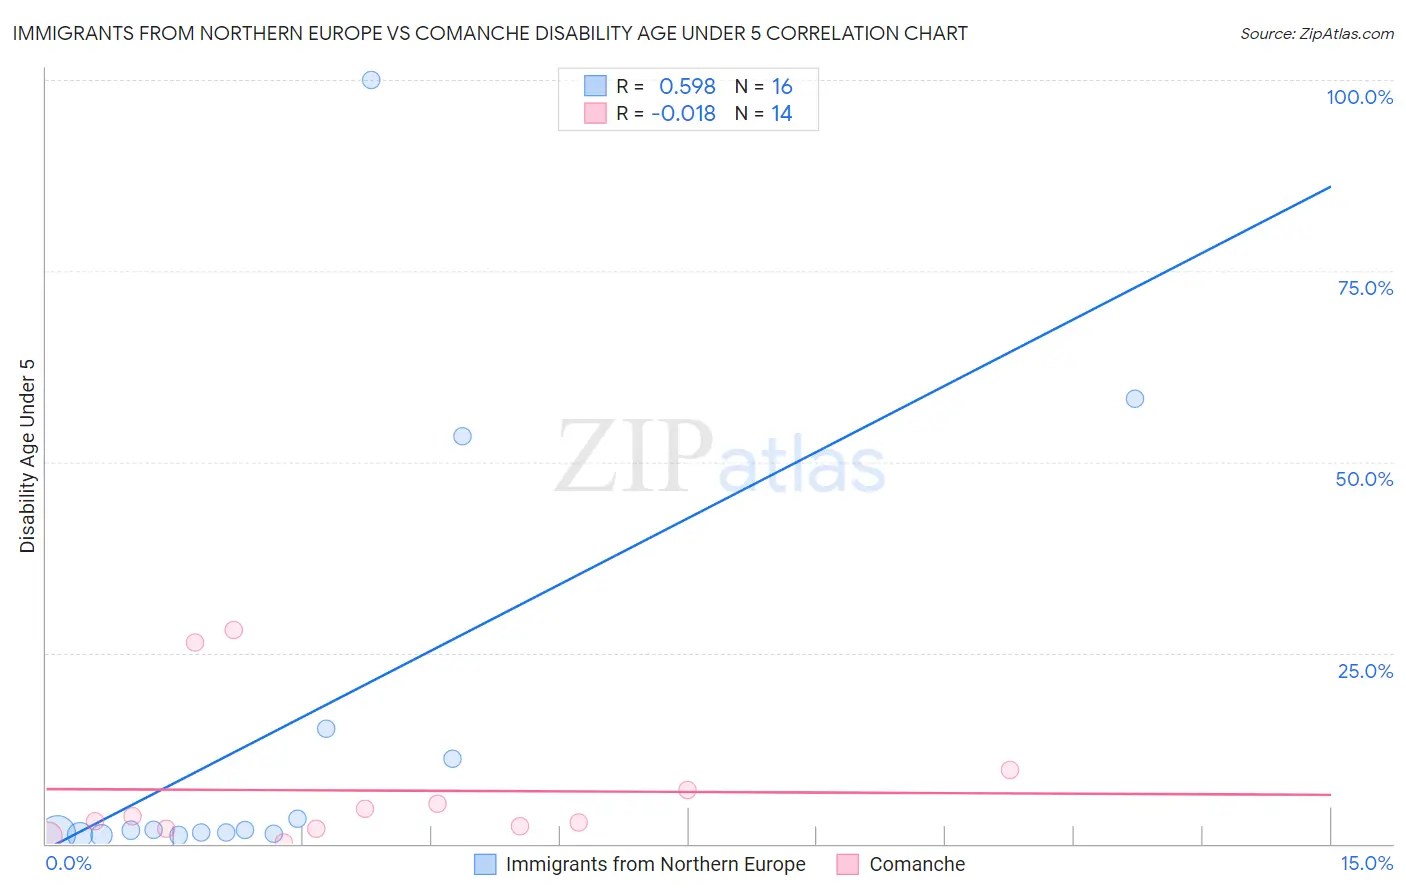
Immigrants from Northern Europe vs Comanche Disability Age Under 5 Correlation Chart
The statistical analysis conducted on geographies consisting of 239,120,906 people shows a substantial positive correlation between the proportion of Immigrants from Northern Europe and percentage of population with a disability under the age of 5 in the United States with a correlation coefficient (R) of 0.598 and weighted average of 1.3%. Similarly, the statistical analysis conducted on geographies consisting of 83,999,768 people shows no correlation between the proportion of Comanche and percentage of population with a disability under the age of 5 in the United States with a correlation coefficient (R) of -0.018 and weighted average of 1.2%, a difference of 6.6%.
Disability Age Under 5 Correlation Summary
| Measurement | Immigrants from Northern Europe | Comanche |
| Minimum | 1.1% | 0.20% |
| Maximum | 100.0% | 28.0% |
| Range | 98.9% | 27.8% |
| Mean | 16.0% | 7.0% |
| Median | 1.8% | 3.3% |
| Interquartile 25% (IQ1) | 1.3% | 2.0% |
| Interquartile 75% (IQ3) | 13.1% | 7.0% |
| Interquartile Range (IQR) | 11.8% | 5.0% |
| Standard Deviation (Sample) | 28.9% | 8.9% |
| Standard Deviation (Population) | 28.0% | 8.6% |
Similar Demographics by Disability Age Under 5
Demographics Similar to Immigrants from Northern Europe by Disability Age Under 5
In terms of disability age under 5, the demographic groups most similar to Immigrants from Northern Europe are French American Indian (1.3%, a difference of 0.13%), Lebanese (1.3%, a difference of 0.25%), Tongan (1.3%, a difference of 0.25%), Immigrants from Costa Rica (1.3%, a difference of 0.34%), and Pueblo (1.3%, a difference of 0.51%).
| Demographics | Rating | Rank | Disability Age Under 5 |
| Latvians | 7.1 /100 | #224 | Tragic 1.3% |
| Panamanians | 7.1 /100 | #225 | Tragic 1.3% |
| Bahamians | 7.1 /100 | #226 | Tragic 1.3% |
| Taiwanese | 6.1 /100 | #227 | Tragic 1.3% |
| Luxembourgers | 6.1 /100 | #228 | Tragic 1.3% |
| Immigrants | Costa Rica | 5.5 /100 | #229 | Tragic 1.3% |
| Lebanese | 5.3 /100 | #230 | Tragic 1.3% |
| Immigrants | Northern Europe | 4.7 /100 | #231 | Tragic 1.3% |
| French American Indians | 4.5 /100 | #232 | Tragic 1.3% |
| Tongans | 4.2 /100 | #233 | Tragic 1.3% |
| Pueblo | 3.8 /100 | #234 | Tragic 1.3% |
| Central American Indians | 3.6 /100 | #235 | Tragic 1.3% |
| South American Indians | 3.3 /100 | #236 | Tragic 1.3% |
| Basques | 3.0 /100 | #237 | Tragic 1.3% |
| Spanish American Indians | 2.4 /100 | #238 | Tragic 1.3% |
Demographics Similar to Comanche by Disability Age Under 5
In terms of disability age under 5, the demographic groups most similar to Comanche are Venezuelan (1.2%, a difference of 0.040%), Immigrants from Kenya (1.2%, a difference of 0.090%), Immigrants from Bahamas (1.2%, a difference of 0.21%), Immigrants from Latvia (1.2%, a difference of 0.22%), and Immigrants from Nigeria (1.2%, a difference of 0.22%).
| Demographics | Rating | Rank | Disability Age Under 5 |
| Immigrants | Jamaica | 58.8 /100 | #170 | Average 1.2% |
| Guamanians/Chamorros | 57.8 /100 | #171 | Average 1.2% |
| Crow | 51.0 /100 | #172 | Average 1.2% |
| Immigrants | Ireland | 50.3 /100 | #173 | Average 1.2% |
| Immigrants | Latvia | 50.0 /100 | #174 | Average 1.2% |
| Immigrants | Nigeria | 50.0 /100 | #175 | Average 1.2% |
| Immigrants | Kenya | 48.6 /100 | #176 | Average 1.2% |
| Comanche | 47.5 /100 | #177 | Average 1.2% |
| Venezuelans | 47.1 /100 | #178 | Average 1.2% |
| Immigrants | Bahamas | 45.2 /100 | #179 | Average 1.2% |
| Immigrants | Mexico | 44.4 /100 | #180 | Average 1.2% |
| Immigrants | Peru | 43.7 /100 | #181 | Average 1.2% |
| Macedonians | 43.7 /100 | #181 | Average 1.2% |
| Immigrants | Saudi Arabia | 43.3 /100 | #183 | Average 1.2% |
| Palestinians | 43.0 /100 | #184 | Average 1.2% |