Ukrainian vs Immigrants from Northern Europe Disability Age 5 to 17
COMPARE
Ukrainian
Immigrants from Northern Europe
Disability Age 5 to 17
Disability Age 5 to 17 Comparison
Ukrainians
Immigrants from Northern Europe
5.6%
DISABILITY AGE 5 TO 17
51.5/ 100
METRIC RATING
172nd/ 347
METRIC RANK
5.3%
DISABILITY AGE 5 TO 17
97.8/ 100
METRIC RATING
114th/ 347
METRIC RANK
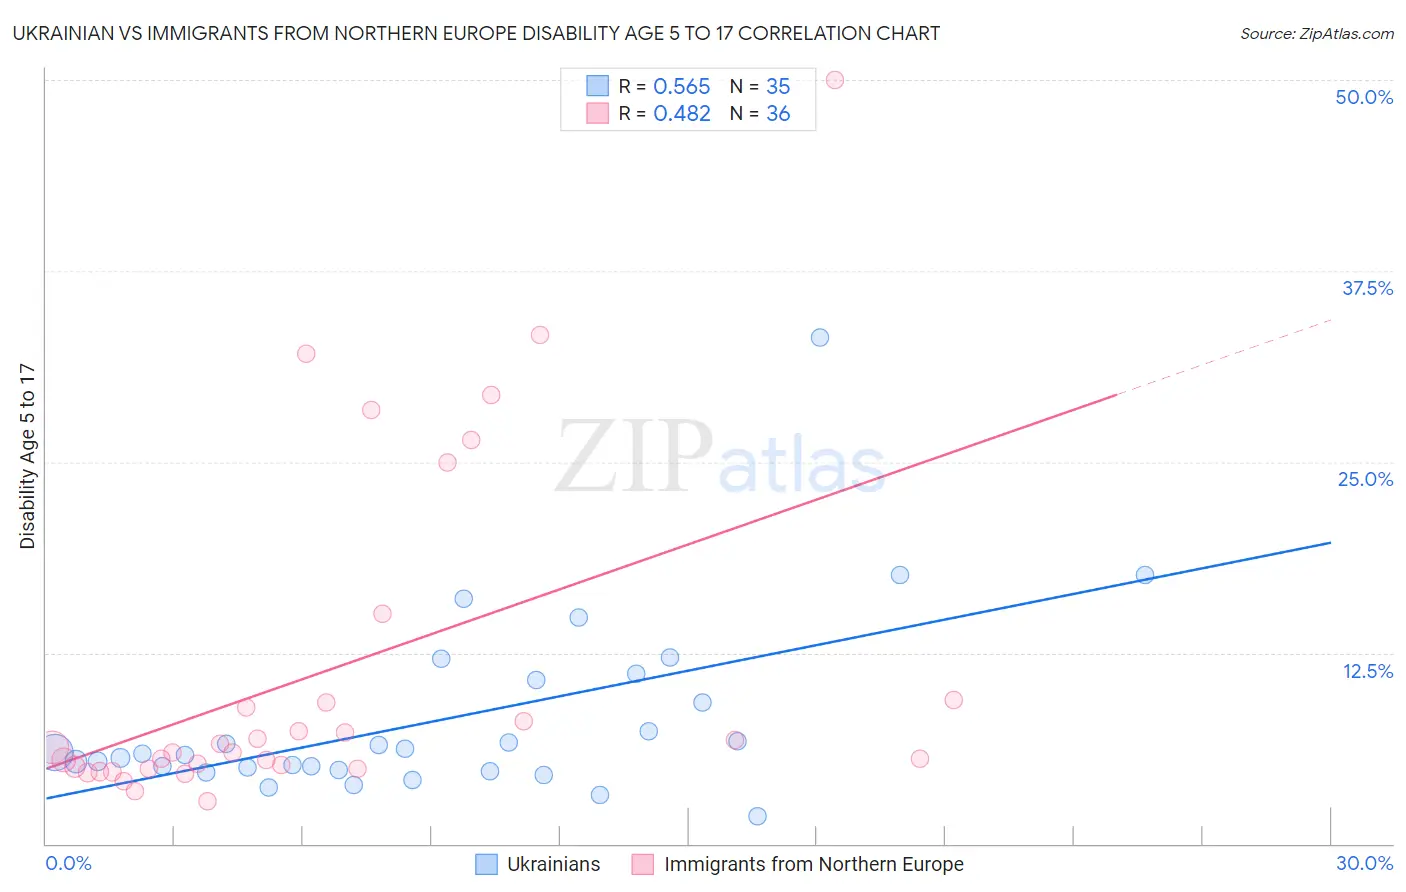
Ukrainian vs Immigrants from Northern Europe Disability Age 5 to 17 Correlation Chart
The statistical analysis conducted on geographies consisting of 442,807,363 people shows a substantial positive correlation between the proportion of Ukrainians and percentage of population with a disability between the ages 5 and 17 in the United States with a correlation coefficient (R) of 0.565 and weighted average of 5.6%. Similarly, the statistical analysis conducted on geographies consisting of 470,776,884 people shows a moderate positive correlation between the proportion of Immigrants from Northern Europe and percentage of population with a disability between the ages 5 and 17 in the United States with a correlation coefficient (R) of 0.482 and weighted average of 5.3%, a difference of 4.8%.
Disability Age 5 to 17 Correlation Summary
| Measurement | Ukrainian | Immigrants from Northern Europe |
| Minimum | 1.8% | 2.8% |
| Maximum | 33.1% | 50.0% |
| Range | 31.3% | 47.2% |
| Mean | 8.1% | 11.2% |
| Median | 5.9% | 6.1% |
| Interquartile 25% (IQ1) | 4.8% | 5.0% |
| Interquartile 75% (IQ3) | 10.7% | 9.3% |
| Interquartile Range (IQR) | 5.9% | 4.4% |
| Standard Deviation (Sample) | 6.0% | 11.2% |
| Standard Deviation (Population) | 5.9% | 11.0% |
Similar Demographics by Disability Age 5 to 17
Demographics Similar to Ukrainians by Disability Age 5 to 17
In terms of disability age 5 to 17, the demographic groups most similar to Ukrainians are Uruguayan (5.6%, a difference of 0.030%), Costa Rican (5.6%, a difference of 0.080%), Shoshone (5.6%, a difference of 0.10%), Immigrants from Central America (5.6%, a difference of 0.11%), and Serbian (5.6%, a difference of 0.12%).
| Demographics | Rating | Rank | Disability Age 5 to 17 |
| Lebanese | 61.4 /100 | #165 | Good 5.6% |
| Greeks | 60.6 /100 | #166 | Good 5.6% |
| Immigrants | Burma/Myanmar | 59.3 /100 | #167 | Average 5.6% |
| Iraqis | 56.0 /100 | #168 | Average 5.6% |
| Immigrants | Norway | 55.7 /100 | #169 | Average 5.6% |
| Serbians | 54.0 /100 | #170 | Average 5.6% |
| Immigrants | Iraq | 53.9 /100 | #171 | Average 5.6% |
| Ukrainians | 51.5 /100 | #172 | Average 5.6% |
| Uruguayans | 51.0 /100 | #173 | Average 5.6% |
| Costa Ricans | 50.0 /100 | #174 | Average 5.6% |
| Shoshone | 49.4 /100 | #175 | Average 5.6% |
| Immigrants | Central America | 49.4 /100 | #176 | Average 5.6% |
| Immigrants | Western Europe | 47.8 /100 | #177 | Average 5.6% |
| Immigrants | Trinidad and Tobago | 47.6 /100 | #178 | Average 5.6% |
| Immigrants | Barbados | 40.5 /100 | #179 | Average 5.6% |
Demographics Similar to Immigrants from Northern Europe by Disability Age 5 to 17
In terms of disability age 5 to 17, the demographic groups most similar to Immigrants from Northern Europe are Cuban (5.3%, a difference of 0.010%), Aleut (5.3%, a difference of 0.020%), Immigrants from Latvia (5.3%, a difference of 0.070%), Cypriot (5.3%, a difference of 0.080%), and Ethiopian (5.3%, a difference of 0.090%).
| Demographics | Rating | Rank | Disability Age 5 to 17 |
| Russians | 98.2 /100 | #107 | Exceptional 5.3% |
| Immigrants | South Africa | 98.1 /100 | #108 | Exceptional 5.3% |
| Immigrants | Northern Africa | 98.1 /100 | #109 | Exceptional 5.3% |
| Immigrants | Eritrea | 98.0 /100 | #110 | Exceptional 5.3% |
| Ethiopians | 97.9 /100 | #111 | Exceptional 5.3% |
| Immigrants | Latvia | 97.9 /100 | #112 | Exceptional 5.3% |
| Aleuts | 97.8 /100 | #113 | Exceptional 5.3% |
| Immigrants | Northern Europe | 97.8 /100 | #114 | Exceptional 5.3% |
| Cubans | 97.8 /100 | #115 | Exceptional 5.3% |
| Cypriots | 97.7 /100 | #116 | Exceptional 5.3% |
| Immigrants | Afghanistan | 97.4 /100 | #117 | Exceptional 5.3% |
| South Americans | 97.1 /100 | #118 | Exceptional 5.4% |
| Immigrants | South America | 97.1 /100 | #119 | Exceptional 5.4% |
| Immigrants | Immigrants | 97.0 /100 | #120 | Exceptional 5.4% |
| Maltese | 96.0 /100 | #121 | Exceptional 5.4% |