Ugandan vs Swedish Self-Care Disability
COMPARE
Ugandan
Swedish
Self-Care Disability
Self-Care Disability Comparison
Ugandans
Swedes
2.3%
SELF-CARE DISABILITY
98.8/ 100
METRIC RATING
81st/ 347
METRIC RANK
2.3%
SELF-CARE DISABILITY
99.3/ 100
METRIC RATING
64th/ 347
METRIC RANK
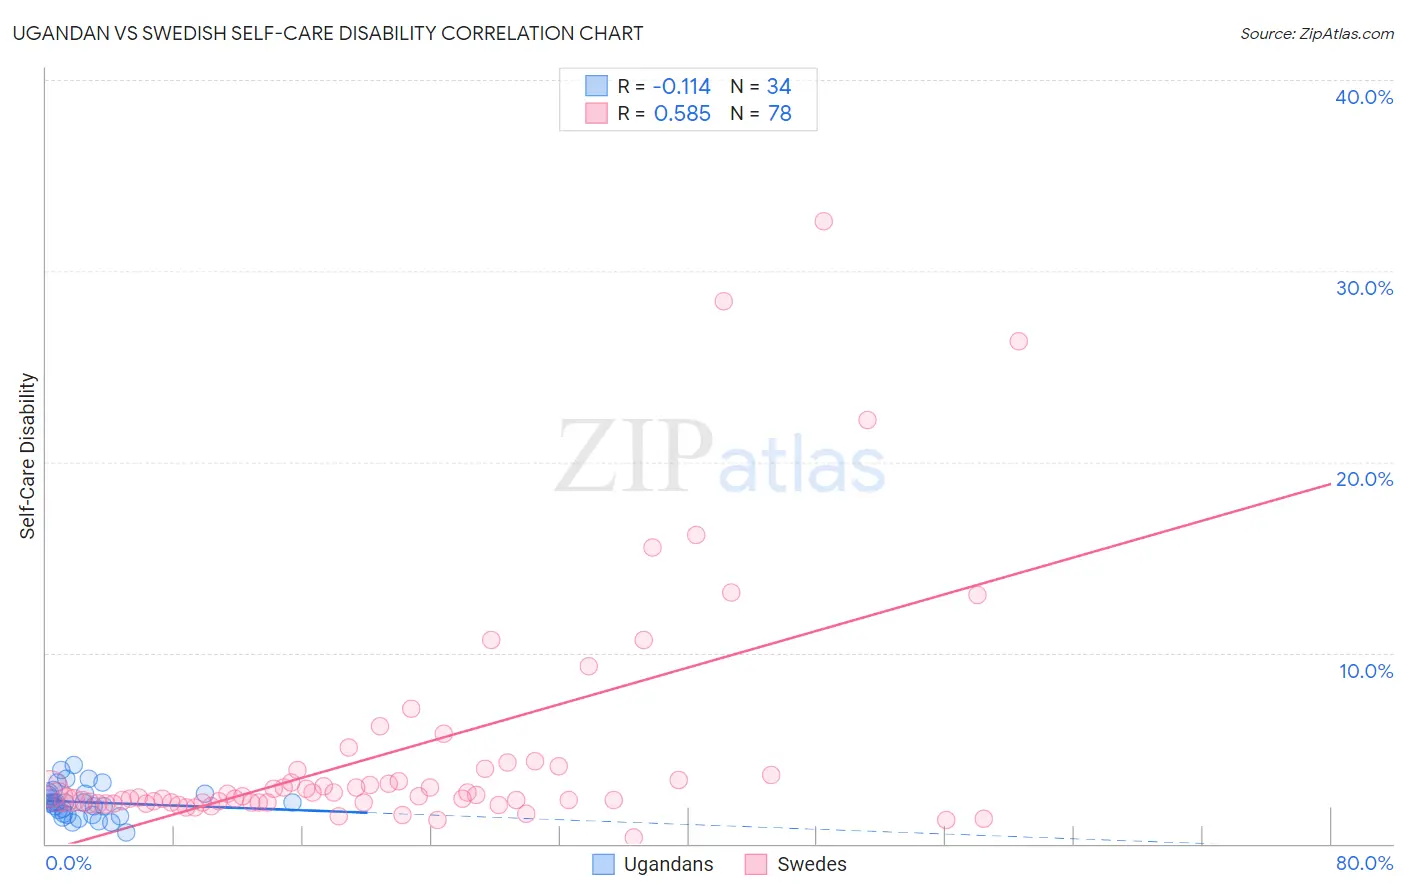
Ugandan vs Swedish Self-Care Disability Correlation Chart
The statistical analysis conducted on geographies consisting of 93,977,399 people shows a poor negative correlation between the proportion of Ugandans and percentage of population with self-care disability in the United States with a correlation coefficient (R) of -0.114 and weighted average of 2.3%. Similarly, the statistical analysis conducted on geographies consisting of 537,435,418 people shows a substantial positive correlation between the proportion of Swedes and percentage of population with self-care disability in the United States with a correlation coefficient (R) of 0.585 and weighted average of 2.3%, a difference of 0.80%.
Self-Care Disability Correlation Summary
| Measurement | Ugandan | Swedish |
| Minimum | 0.57% | 0.30% |
| Maximum | 4.1% | 32.6% |
| Range | 3.5% | 32.3% |
| Mean | 2.2% | 4.8% |
| Median | 2.2% | 2.5% |
| Interquartile 25% (IQ1) | 1.5% | 2.1% |
| Interquartile 75% (IQ3) | 2.6% | 3.9% |
| Interquartile Range (IQR) | 1.1% | 1.7% |
| Standard Deviation (Sample) | 0.82% | 6.2% |
| Standard Deviation (Population) | 0.81% | 6.2% |
Demographics Similar to Ugandans and Swedes by Self-Care Disability
In terms of self-care disability, the demographic groups most similar to Ugandans are Immigrants from Denmark (2.3%, a difference of 0.0%), Chilean (2.3%, a difference of 0.070%), Immigrants from Middle Africa (2.3%, a difference of 0.26%), Immigrants from Ireland (2.3%, a difference of 0.26%), and Immigrants from Kenya (2.3%, a difference of 0.26%). Similarly, the demographic groups most similar to Swedes are Mongolian (2.3%, a difference of 0.010%), Brazilian (2.3%, a difference of 0.060%), Egyptian (2.3%, a difference of 0.090%), Immigrants from Argentina (2.3%, a difference of 0.090%), and South African (2.3%, a difference of 0.12%).
| Demographics | Rating | Rank | Self-Care Disability |
| Egyptians | 99.4 /100 | #62 | Exceptional 2.3% |
| Mongolians | 99.3 /100 | #63 | Exceptional 2.3% |
| Swedes | 99.3 /100 | #64 | Exceptional 2.3% |
| Brazilians | 99.3 /100 | #65 | Exceptional 2.3% |
| Immigrants | Argentina | 99.3 /100 | #66 | Exceptional 2.3% |
| South Africans | 99.3 /100 | #67 | Exceptional 2.3% |
| Immigrants | Zaire | 99.2 /100 | #68 | Exceptional 2.3% |
| Immigrants | Norway | 99.2 /100 | #69 | Exceptional 2.3% |
| Immigrants | Northern Europe | 99.2 /100 | #70 | Exceptional 2.3% |
| Asians | 99.2 /100 | #71 | Exceptional 2.3% |
| Eastern Europeans | 99.2 /100 | #72 | Exceptional 2.3% |
| Immigrants | Egypt | 99.1 /100 | #73 | Exceptional 2.3% |
| Immigrants | Switzerland | 99.1 /100 | #74 | Exceptional 2.3% |
| Immigrants | Netherlands | 99.1 /100 | #75 | Exceptional 2.3% |
| Immigrants | China | 99.1 /100 | #76 | Exceptional 2.3% |
| Immigrants | Middle Africa | 99.0 /100 | #77 | Exceptional 2.3% |
| Immigrants | Ireland | 99.0 /100 | #78 | Exceptional 2.3% |
| Immigrants | Kenya | 99.0 /100 | #79 | Exceptional 2.3% |
| Chileans | 98.8 /100 | #80 | Exceptional 2.3% |
| Ugandans | 98.8 /100 | #81 | Exceptional 2.3% |
| Immigrants | Denmark | 98.8 /100 | #82 | Exceptional 2.3% |