Tsimshian vs Ugandan Disability Age 65 to 74
COMPARE
Tsimshian
Ugandan
Disability Age 65 to 74
Disability Age 65 to 74 Comparison
Tsimshian
Ugandans
32.9%
DISABILITY AGE 65 TO 74
0.0/ 100
METRIC RATING
341st/ 347
METRIC RANK
22.7%
DISABILITY AGE 65 TO 74
85.4/ 100
METRIC RATING
140th/ 347
METRIC RANK
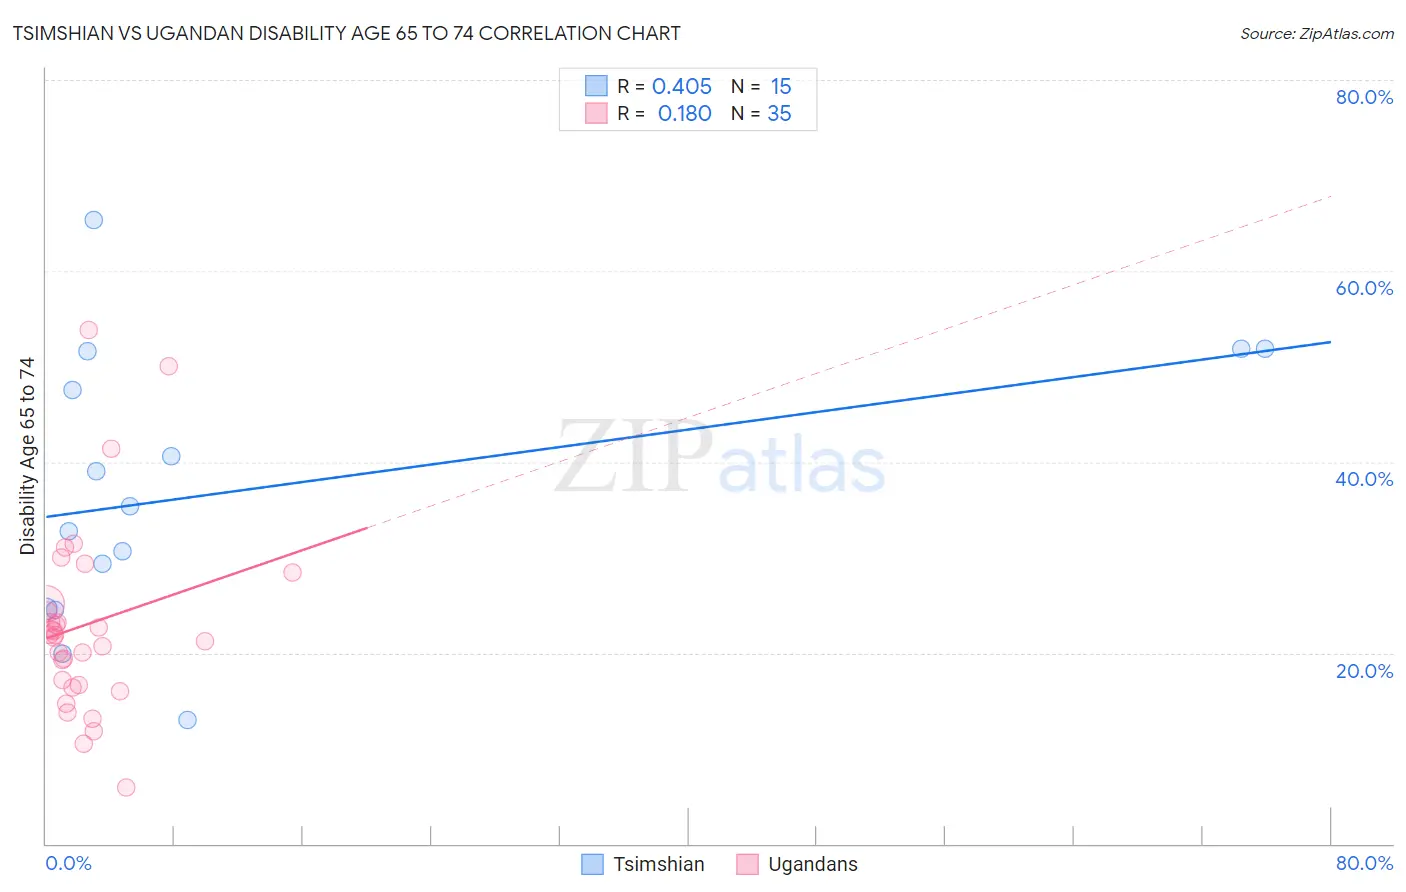
Tsimshian vs Ugandan Disability Age 65 to 74 Correlation Chart
The statistical analysis conducted on geographies consisting of 15,620,176 people shows a moderate positive correlation between the proportion of Tsimshian and percentage of population with a disability between the ages 65 and 75 in the United States with a correlation coefficient (R) of 0.405 and weighted average of 32.9%. Similarly, the statistical analysis conducted on geographies consisting of 93,935,891 people shows a poor positive correlation between the proportion of Ugandans and percentage of population with a disability between the ages 65 and 75 in the United States with a correlation coefficient (R) of 0.180 and weighted average of 22.7%, a difference of 44.7%.
Disability Age 65 to 74 Correlation Summary
| Measurement | Tsimshian | Ugandan |
| Minimum | 13.0% | 5.9% |
| Maximum | 65.3% | 53.8% |
| Range | 52.3% | 48.0% |
| Mean | 37.2% | 23.0% |
| Median | 35.4% | 21.9% |
| Interquartile 25% (IQ1) | 24.6% | 16.7% |
| Interquartile 75% (IQ3) | 51.6% | 25.1% |
| Interquartile Range (IQR) | 27.0% | 8.4% |
| Standard Deviation (Sample) | 14.4% | 9.9% |
| Standard Deviation (Population) | 13.9% | 9.8% |
Similar Demographics by Disability Age 65 to 74
Demographics Similar to Tsimshian by Disability Age 65 to 74
In terms of disability age 65 to 74, the demographic groups most similar to Tsimshian are Lumbee (32.7%, a difference of 0.53%), Pueblo (33.1%, a difference of 0.60%), Kiowa (32.6%, a difference of 1.1%), Navajo (33.3%, a difference of 1.3%), and Alaskan Athabascan (32.4%, a difference of 1.7%).
| Demographics | Rating | Rank | Disability Age 65 to 74 |
| Colville | 0.0 /100 | #333 | Tragic 30.5% |
| Alaska Natives | 0.0 /100 | #334 | Tragic 30.6% |
| Cheyenne | 0.0 /100 | #335 | Tragic 31.1% |
| Yuman | 0.0 /100 | #336 | Tragic 31.5% |
| Houma | 0.0 /100 | #337 | Tragic 32.3% |
| Alaskan Athabascans | 0.0 /100 | #338 | Tragic 32.4% |
| Kiowa | 0.0 /100 | #339 | Tragic 32.6% |
| Lumbee | 0.0 /100 | #340 | Tragic 32.7% |
| Tsimshian | 0.0 /100 | #341 | Tragic 32.9% |
| Pueblo | 0.0 /100 | #342 | Tragic 33.1% |
| Navajo | 0.0 /100 | #343 | Tragic 33.3% |
| Inupiat | 0.0 /100 | #344 | Tragic 34.5% |
| Tohono O'odham | 0.0 /100 | #345 | Tragic 36.0% |
| Yup'ik | 0.0 /100 | #346 | Tragic 37.8% |
| Pima | 0.0 /100 | #347 | Tragic 38.6% |
Demographics Similar to Ugandans by Disability Age 65 to 74
In terms of disability age 65 to 74, the demographic groups most similar to Ugandans are Belgian (22.7%, a difference of 0.010%), Immigrants from Ethiopia (22.7%, a difference of 0.020%), Immigrants from Syria (22.7%, a difference of 0.040%), Arab (22.8%, a difference of 0.080%), and Danish (22.8%, a difference of 0.12%).
| Demographics | Rating | Rank | Disability Age 65 to 74 |
| Northern Europeans | 88.9 /100 | #133 | Excellent 22.6% |
| Afghans | 88.6 /100 | #134 | Excellent 22.6% |
| Immigrants | Ukraine | 88.4 /100 | #135 | Excellent 22.6% |
| Ethiopians | 87.9 /100 | #136 | Excellent 22.7% |
| Taiwanese | 87.6 /100 | #137 | Excellent 22.7% |
| Immigrants | Moldova | 87.3 /100 | #138 | Excellent 22.7% |
| Immigrants | Syria | 85.8 /100 | #139 | Excellent 22.7% |
| Ugandans | 85.4 /100 | #140 | Excellent 22.7% |
| Belgians | 85.3 /100 | #141 | Excellent 22.7% |
| Immigrants | Ethiopia | 85.3 /100 | #142 | Excellent 22.7% |
| Arabs | 84.8 /100 | #143 | Excellent 22.8% |
| Danes | 84.4 /100 | #144 | Excellent 22.8% |
| Immigrants | Uganda | 84.0 /100 | #145 | Excellent 22.8% |
| Alsatians | 83.7 /100 | #146 | Excellent 22.8% |
| Immigrants | Uzbekistan | 83.1 /100 | #147 | Excellent 22.8% |