Czech vs Ugandan Disability Age 65 to 74
COMPARE
Czech
Ugandan
Disability Age 65 to 74
Disability Age 65 to 74 Comparison
Czechs
Ugandans
22.4%
DISABILITY AGE 65 TO 74
93.5/ 100
METRIC RATING
121st/ 347
METRIC RANK
22.7%
DISABILITY AGE 65 TO 74
85.4/ 100
METRIC RATING
140th/ 347
METRIC RANK
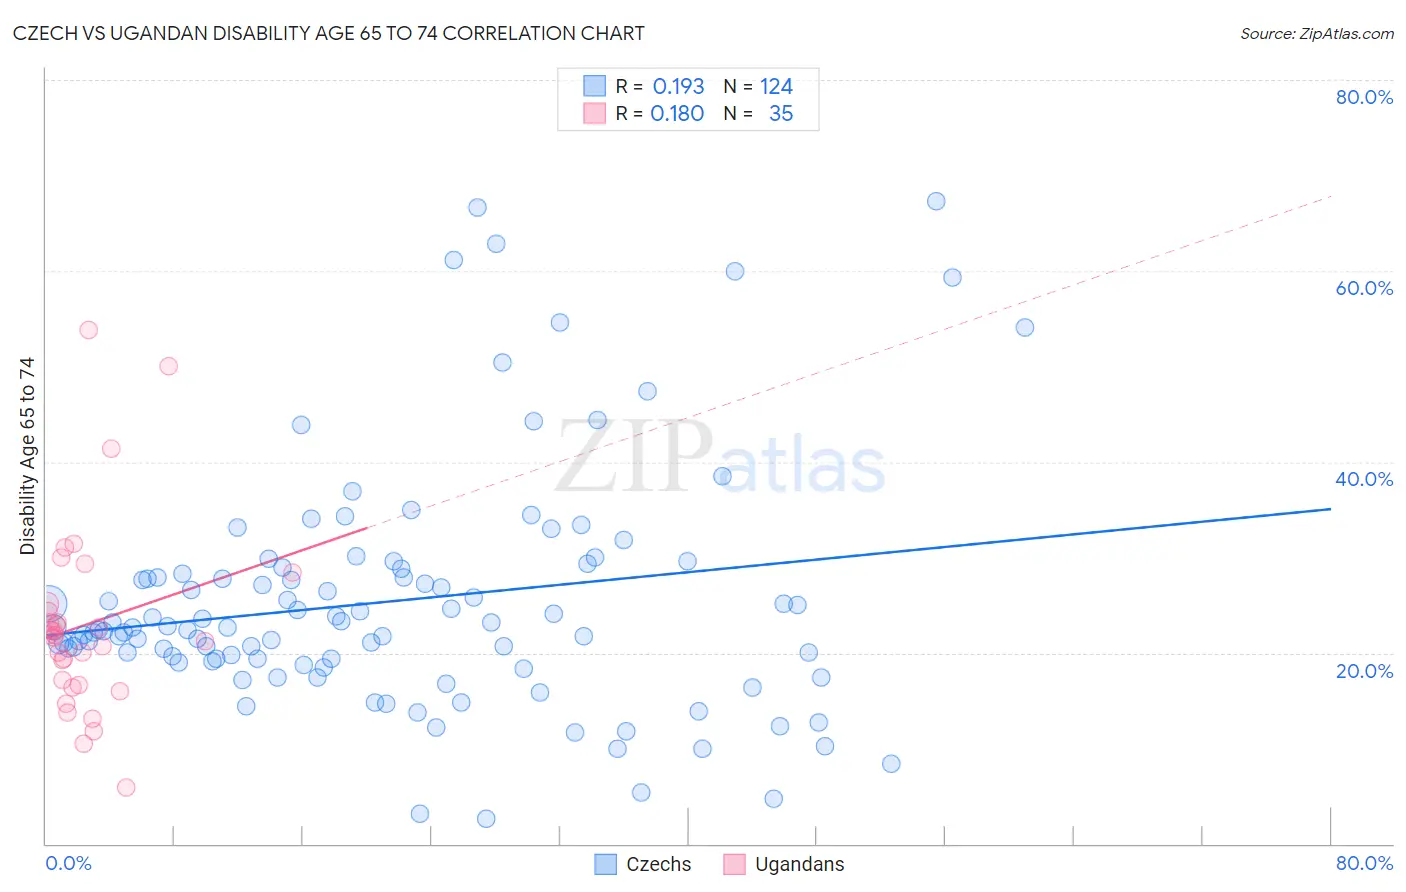
Czech vs Ugandan Disability Age 65 to 74 Correlation Chart
The statistical analysis conducted on geographies consisting of 483,519,300 people shows a poor positive correlation between the proportion of Czechs and percentage of population with a disability between the ages 65 and 75 in the United States with a correlation coefficient (R) of 0.193 and weighted average of 22.4%. Similarly, the statistical analysis conducted on geographies consisting of 93,935,891 people shows a poor positive correlation between the proportion of Ugandans and percentage of population with a disability between the ages 65 and 75 in the United States with a correlation coefficient (R) of 0.180 and weighted average of 22.7%, a difference of 1.4%.
Disability Age 65 to 74 Correlation Summary
| Measurement | Czech | Ugandan |
| Minimum | 2.7% | 5.9% |
| Maximum | 67.3% | 53.8% |
| Range | 64.7% | 48.0% |
| Mean | 25.4% | 23.0% |
| Median | 22.6% | 21.9% |
| Interquartile 25% (IQ1) | 19.3% | 16.7% |
| Interquartile 75% (IQ3) | 28.6% | 25.1% |
| Interquartile Range (IQR) | 9.3% | 8.4% |
| Standard Deviation (Sample) | 12.5% | 9.9% |
| Standard Deviation (Population) | 12.4% | 9.8% |
Demographics Similar to Czechs and Ugandans by Disability Age 65 to 74
In terms of disability age 65 to 74, the demographic groups most similar to Czechs are Immigrants from Jordan (22.4%, a difference of 0.0%), Hungarian (22.4%, a difference of 0.050%), Immigrants from Kazakhstan (22.4%, a difference of 0.10%), Norwegian (22.5%, a difference of 0.24%), and Immigrants from Western Europe (22.5%, a difference of 0.28%). Similarly, the demographic groups most similar to Ugandans are Immigrants from Syria (22.7%, a difference of 0.040%), Immigrants from Moldova (22.7%, a difference of 0.23%), Taiwanese (22.7%, a difference of 0.29%), Ethiopian (22.7%, a difference of 0.32%), and Immigrants from Ukraine (22.6%, a difference of 0.39%).
| Demographics | Rating | Rank | Disability Age 65 to 74 |
| Immigrants | Kazakhstan | 93.9 /100 | #120 | Exceptional 22.4% |
| Czechs | 93.5 /100 | #121 | Exceptional 22.4% |
| Immigrants | Jordan | 93.5 /100 | #122 | Exceptional 22.4% |
| Hungarians | 93.3 /100 | #123 | Exceptional 22.4% |
| Norwegians | 92.5 /100 | #124 | Exceptional 22.5% |
| Immigrants | Western Europe | 92.3 /100 | #125 | Exceptional 22.5% |
| Lebanese | 92.2 /100 | #126 | Exceptional 22.5% |
| Slovaks | 91.6 /100 | #127 | Exceptional 22.5% |
| Immigrants | Costa Rica | 90.4 /100 | #128 | Exceptional 22.6% |
| Immigrants | Uruguay | 90.1 /100 | #129 | Exceptional 22.6% |
| Immigrants | Albania | 90.0 /100 | #130 | Excellent 22.6% |
| Immigrants | Nepal | 89.4 /100 | #131 | Excellent 22.6% |
| Costa Ricans | 89.2 /100 | #132 | Excellent 22.6% |
| Northern Europeans | 88.9 /100 | #133 | Excellent 22.6% |
| Afghans | 88.6 /100 | #134 | Excellent 22.6% |
| Immigrants | Ukraine | 88.4 /100 | #135 | Excellent 22.6% |
| Ethiopians | 87.9 /100 | #136 | Excellent 22.7% |
| Taiwanese | 87.6 /100 | #137 | Excellent 22.7% |
| Immigrants | Moldova | 87.3 /100 | #138 | Excellent 22.7% |
| Immigrants | Syria | 85.8 /100 | #139 | Excellent 22.7% |
| Ugandans | 85.4 /100 | #140 | Excellent 22.7% |