Slovene vs Ugandan Disability Age 65 to 74
COMPARE
Slovene
Ugandan
Disability Age 65 to 74
Disability Age 65 to 74 Comparison
Slovenes
Ugandans
22.2%
DISABILITY AGE 65 TO 74
96.1/ 100
METRIC RATING
107th/ 347
METRIC RANK
22.7%
DISABILITY AGE 65 TO 74
85.4/ 100
METRIC RATING
140th/ 347
METRIC RANK
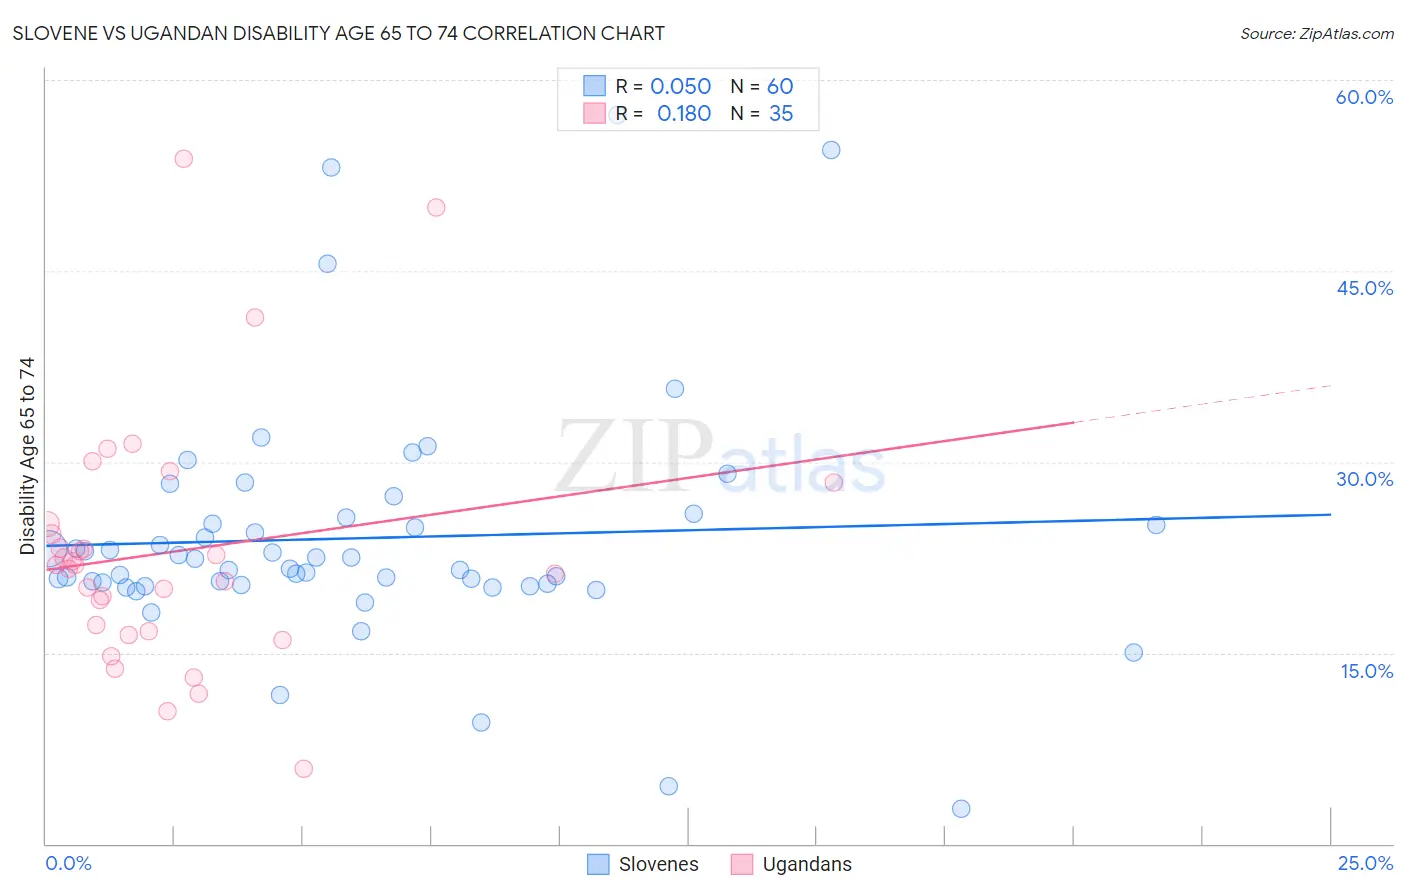
Slovene vs Ugandan Disability Age 65 to 74 Correlation Chart
The statistical analysis conducted on geographies consisting of 261,130,242 people shows a slight positive correlation between the proportion of Slovenes and percentage of population with a disability between the ages 65 and 75 in the United States with a correlation coefficient (R) of 0.050 and weighted average of 22.2%. Similarly, the statistical analysis conducted on geographies consisting of 93,935,891 people shows a poor positive correlation between the proportion of Ugandans and percentage of population with a disability between the ages 65 and 75 in the United States with a correlation coefficient (R) of 0.180 and weighted average of 22.7%, a difference of 2.2%.
Disability Age 65 to 74 Correlation Summary
| Measurement | Slovene | Ugandan |
| Minimum | 2.8% | 5.9% |
| Maximum | 57.2% | 53.8% |
| Range | 54.5% | 48.0% |
| Mean | 24.0% | 23.0% |
| Median | 22.0% | 21.9% |
| Interquartile 25% (IQ1) | 20.4% | 16.7% |
| Interquartile 75% (IQ3) | 25.4% | 25.1% |
| Interquartile Range (IQR) | 5.0% | 8.4% |
| Standard Deviation (Sample) | 9.6% | 9.9% |
| Standard Deviation (Population) | 9.5% | 9.8% |
Similar Demographics by Disability Age 65 to 74
Demographics Similar to Slovenes by Disability Age 65 to 74
In terms of disability age 65 to 74, the demographic groups most similar to Slovenes are Peruvian (22.2%, a difference of 0.010%), Immigrants from Zimbabwe (22.3%, a difference of 0.010%), Palestinian (22.2%, a difference of 0.070%), Albanian (22.3%, a difference of 0.10%), and Colombian (22.2%, a difference of 0.11%).
| Demographics | Rating | Rank | Disability Age 65 to 74 |
| Uruguayans | 96.5 /100 | #100 | Exceptional 22.2% |
| Immigrants | England | 96.5 /100 | #101 | Exceptional 22.2% |
| Immigrants | Saudi Arabia | 96.4 /100 | #102 | Exceptional 22.2% |
| South Americans | 96.4 /100 | #103 | Exceptional 22.2% |
| Colombians | 96.4 /100 | #104 | Exceptional 22.2% |
| Palestinians | 96.3 /100 | #105 | Exceptional 22.2% |
| Peruvians | 96.1 /100 | #106 | Exceptional 22.2% |
| Slovenes | 96.1 /100 | #107 | Exceptional 22.2% |
| Immigrants | Zimbabwe | 96.1 /100 | #108 | Exceptional 22.3% |
| Albanians | 95.8 /100 | #109 | Exceptional 22.3% |
| Immigrants | Peru | 95.7 /100 | #110 | Exceptional 22.3% |
| Serbians | 95.7 /100 | #111 | Exceptional 22.3% |
| Immigrants | South America | 95.5 /100 | #112 | Exceptional 22.3% |
| Syrians | 95.3 /100 | #113 | Exceptional 22.3% |
| Ukrainians | 95.1 /100 | #114 | Exceptional 22.3% |
Demographics Similar to Ugandans by Disability Age 65 to 74
In terms of disability age 65 to 74, the demographic groups most similar to Ugandans are Belgian (22.7%, a difference of 0.010%), Immigrants from Ethiopia (22.7%, a difference of 0.020%), Immigrants from Syria (22.7%, a difference of 0.040%), Arab (22.8%, a difference of 0.080%), and Danish (22.8%, a difference of 0.12%).
| Demographics | Rating | Rank | Disability Age 65 to 74 |
| Northern Europeans | 88.9 /100 | #133 | Excellent 22.6% |
| Afghans | 88.6 /100 | #134 | Excellent 22.6% |
| Immigrants | Ukraine | 88.4 /100 | #135 | Excellent 22.6% |
| Ethiopians | 87.9 /100 | #136 | Excellent 22.7% |
| Taiwanese | 87.6 /100 | #137 | Excellent 22.7% |
| Immigrants | Moldova | 87.3 /100 | #138 | Excellent 22.7% |
| Immigrants | Syria | 85.8 /100 | #139 | Excellent 22.7% |
| Ugandans | 85.4 /100 | #140 | Excellent 22.7% |
| Belgians | 85.3 /100 | #141 | Excellent 22.7% |
| Immigrants | Ethiopia | 85.3 /100 | #142 | Excellent 22.7% |
| Arabs | 84.8 /100 | #143 | Excellent 22.8% |
| Danes | 84.4 /100 | #144 | Excellent 22.8% |
| Immigrants | Uganda | 84.0 /100 | #145 | Excellent 22.8% |
| Alsatians | 83.7 /100 | #146 | Excellent 22.8% |
| Immigrants | Uzbekistan | 83.1 /100 | #147 | Excellent 22.8% |