Immigrants from Switzerland vs Ugandan Disability Age 65 to 74
COMPARE
Immigrants from Switzerland
Ugandan
Disability Age 65 to 74
Disability Age 65 to 74 Comparison
Immigrants from Switzerland
Ugandans
21.1%
DISABILITY AGE 65 TO 74
99.8/ 100
METRIC RATING
36th/ 347
METRIC RANK
22.7%
DISABILITY AGE 65 TO 74
85.4/ 100
METRIC RATING
140th/ 347
METRIC RANK
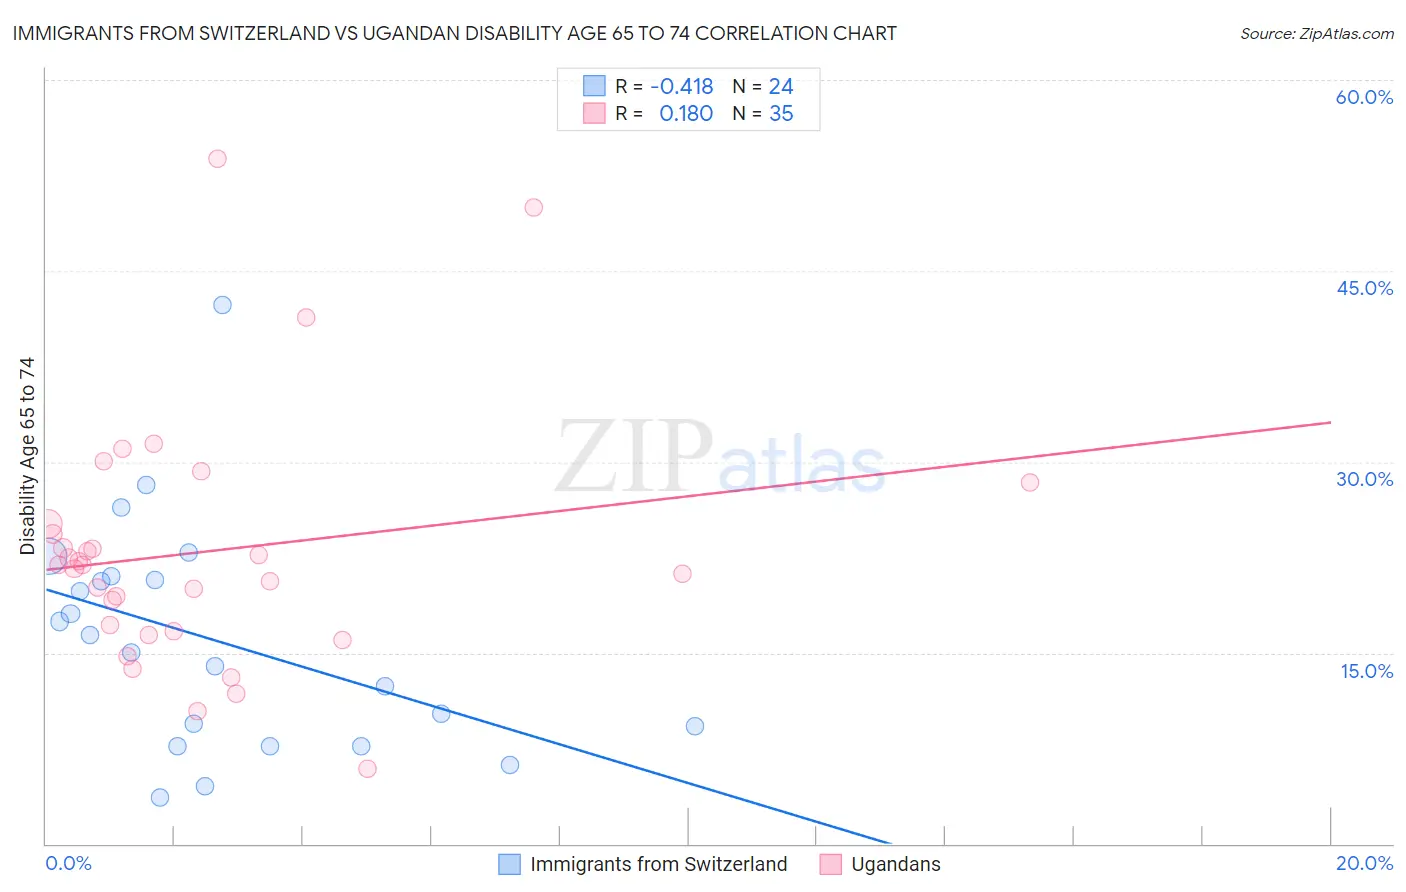
Immigrants from Switzerland vs Ugandan Disability Age 65 to 74 Correlation Chart
The statistical analysis conducted on geographies consisting of 147,992,813 people shows a moderate negative correlation between the proportion of Immigrants from Switzerland and percentage of population with a disability between the ages 65 and 75 in the United States with a correlation coefficient (R) of -0.418 and weighted average of 21.1%. Similarly, the statistical analysis conducted on geographies consisting of 93,935,891 people shows a poor positive correlation between the proportion of Ugandans and percentage of population with a disability between the ages 65 and 75 in the United States with a correlation coefficient (R) of 0.180 and weighted average of 22.7%, a difference of 7.6%.
Disability Age 65 to 74 Correlation Summary
| Measurement | Immigrants from Switzerland | Ugandan |
| Minimum | 3.7% | 5.9% |
| Maximum | 42.3% | 53.8% |
| Range | 38.6% | 48.0% |
| Mean | 16.0% | 23.0% |
| Median | 15.7% | 21.9% |
| Interquartile 25% (IQ1) | 8.5% | 16.7% |
| Interquartile 75% (IQ3) | 20.8% | 25.1% |
| Interquartile Range (IQR) | 12.4% | 8.4% |
| Standard Deviation (Sample) | 9.0% | 9.9% |
| Standard Deviation (Population) | 8.8% | 9.8% |
Similar Demographics by Disability Age 65 to 74
Demographics Similar to Immigrants from Switzerland by Disability Age 65 to 74
In terms of disability age 65 to 74, the demographic groups most similar to Immigrants from Switzerland are Israeli (21.2%, a difference of 0.11%), Russian (21.2%, a difference of 0.11%), Bulgarian (21.1%, a difference of 0.19%), Immigrants from Sri Lanka (21.1%, a difference of 0.25%), and Immigrants from Argentina (21.1%, a difference of 0.28%).
| Demographics | Rating | Rank | Disability Age 65 to 74 |
| Immigrants | Japan | 99.9 /100 | #29 | Exceptional 21.0% |
| Immigrants | Greece | 99.9 /100 | #30 | Exceptional 21.0% |
| Immigrants | Northern Europe | 99.9 /100 | #31 | Exceptional 21.0% |
| Turks | 99.9 /100 | #32 | Exceptional 21.0% |
| Immigrants | Argentina | 99.9 /100 | #33 | Exceptional 21.1% |
| Immigrants | Sri Lanka | 99.9 /100 | #34 | Exceptional 21.1% |
| Bulgarians | 99.9 /100 | #35 | Exceptional 21.1% |
| Immigrants | Switzerland | 99.8 /100 | #36 | Exceptional 21.1% |
| Israelis | 99.8 /100 | #37 | Exceptional 21.2% |
| Russians | 99.8 /100 | #38 | Exceptional 21.2% |
| Argentineans | 99.8 /100 | #39 | Exceptional 21.2% |
| Latvians | 99.8 /100 | #40 | Exceptional 21.2% |
| Immigrants | Austria | 99.8 /100 | #41 | Exceptional 21.2% |
| Macedonians | 99.7 /100 | #42 | Exceptional 21.3% |
| Immigrants | Croatia | 99.7 /100 | #43 | Exceptional 21.3% |
Demographics Similar to Ugandans by Disability Age 65 to 74
In terms of disability age 65 to 74, the demographic groups most similar to Ugandans are Belgian (22.7%, a difference of 0.010%), Immigrants from Ethiopia (22.7%, a difference of 0.020%), Immigrants from Syria (22.7%, a difference of 0.040%), Arab (22.8%, a difference of 0.080%), and Danish (22.8%, a difference of 0.12%).
| Demographics | Rating | Rank | Disability Age 65 to 74 |
| Northern Europeans | 88.9 /100 | #133 | Excellent 22.6% |
| Afghans | 88.6 /100 | #134 | Excellent 22.6% |
| Immigrants | Ukraine | 88.4 /100 | #135 | Excellent 22.6% |
| Ethiopians | 87.9 /100 | #136 | Excellent 22.7% |
| Taiwanese | 87.6 /100 | #137 | Excellent 22.7% |
| Immigrants | Moldova | 87.3 /100 | #138 | Excellent 22.7% |
| Immigrants | Syria | 85.8 /100 | #139 | Excellent 22.7% |
| Ugandans | 85.4 /100 | #140 | Excellent 22.7% |
| Belgians | 85.3 /100 | #141 | Excellent 22.7% |
| Immigrants | Ethiopia | 85.3 /100 | #142 | Excellent 22.7% |
| Arabs | 84.8 /100 | #143 | Excellent 22.8% |
| Danes | 84.4 /100 | #144 | Excellent 22.8% |
| Immigrants | Uganda | 84.0 /100 | #145 | Excellent 22.8% |
| Alsatians | 83.7 /100 | #146 | Excellent 22.8% |
| Immigrants | Uzbekistan | 83.1 /100 | #147 | Excellent 22.8% |