Tsimshian vs Immigrants from Germany Disability Age 65 to 74
COMPARE
Tsimshian
Immigrants from Germany
Disability Age 65 to 74
Disability Age 65 to 74 Comparison
Tsimshian
Immigrants from Germany
32.9%
DISABILITY AGE 65 TO 74
0.0/ 100
METRIC RATING
341st/ 347
METRIC RANK
23.4%
DISABILITY AGE 65 TO 74
42.5/ 100
METRIC RATING
184th/ 347
METRIC RANK
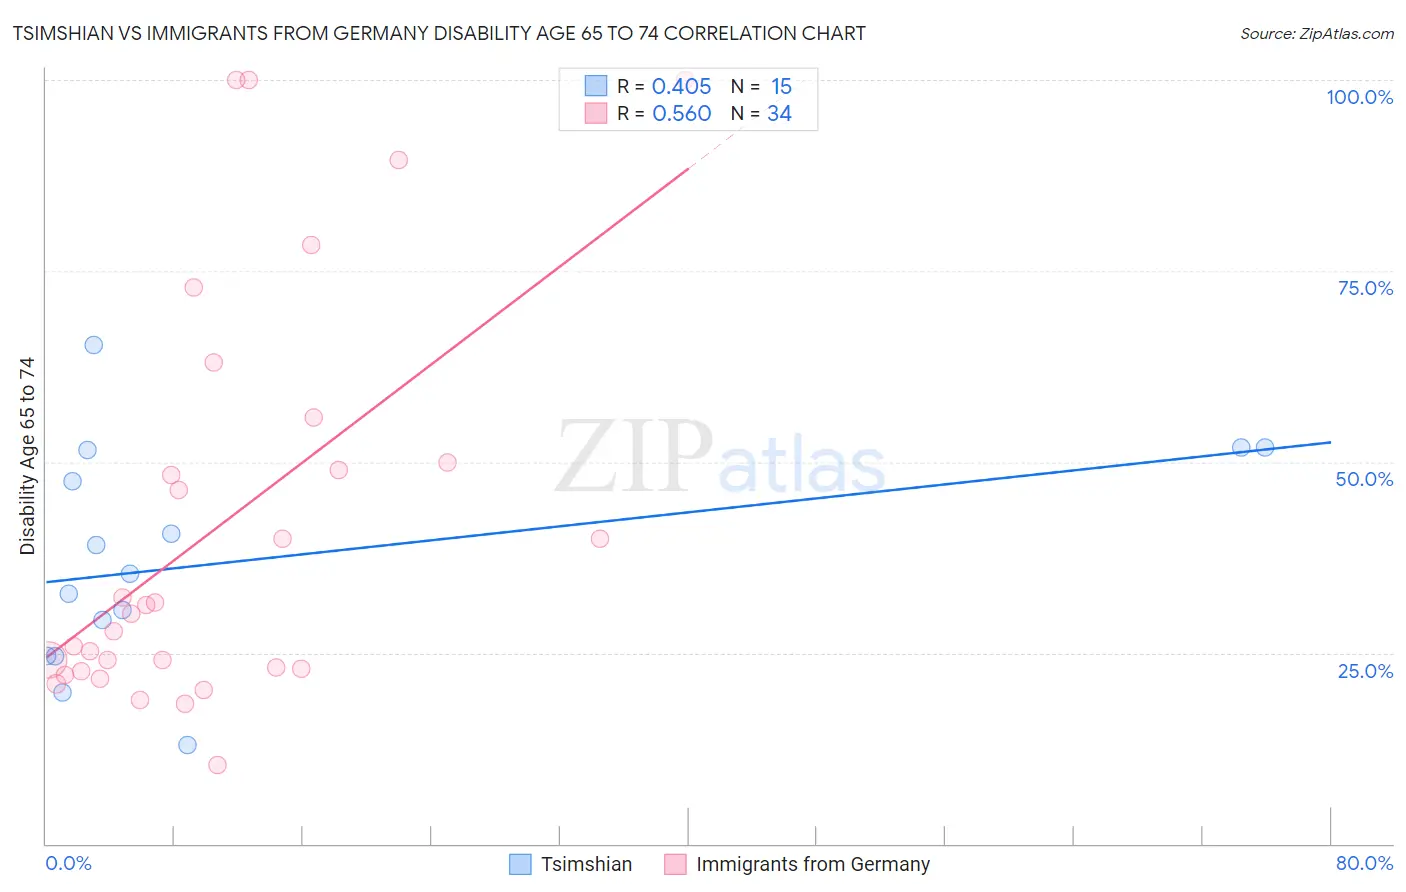
Tsimshian vs Immigrants from Germany Disability Age 65 to 74 Correlation Chart
The statistical analysis conducted on geographies consisting of 15,620,176 people shows a moderate positive correlation between the proportion of Tsimshian and percentage of population with a disability between the ages 65 and 75 in the United States with a correlation coefficient (R) of 0.405 and weighted average of 32.9%. Similarly, the statistical analysis conducted on geographies consisting of 463,135,745 people shows a substantial positive correlation between the proportion of Immigrants from Germany and percentage of population with a disability between the ages 65 and 75 in the United States with a correlation coefficient (R) of 0.560 and weighted average of 23.4%, a difference of 40.3%.
Disability Age 65 to 74 Correlation Summary
| Measurement | Tsimshian | Immigrants from Germany |
| Minimum | 13.0% | 10.4% |
| Maximum | 65.3% | 100.0% |
| Range | 52.3% | 89.6% |
| Mean | 37.2% | 41.5% |
| Median | 35.4% | 30.7% |
| Interquartile 25% (IQ1) | 24.6% | 22.9% |
| Interquartile 75% (IQ3) | 51.6% | 50.0% |
| Interquartile Range (IQR) | 27.0% | 27.1% |
| Standard Deviation (Sample) | 14.4% | 26.1% |
| Standard Deviation (Population) | 13.9% | 25.7% |
Similar Demographics by Disability Age 65 to 74
Demographics Similar to Tsimshian by Disability Age 65 to 74
In terms of disability age 65 to 74, the demographic groups most similar to Tsimshian are Lumbee (32.7%, a difference of 0.53%), Pueblo (33.1%, a difference of 0.60%), Kiowa (32.6%, a difference of 1.1%), Navajo (33.3%, a difference of 1.3%), and Alaskan Athabascan (32.4%, a difference of 1.7%).
| Demographics | Rating | Rank | Disability Age 65 to 74 |
| Colville | 0.0 /100 | #333 | Tragic 30.5% |
| Alaska Natives | 0.0 /100 | #334 | Tragic 30.6% |
| Cheyenne | 0.0 /100 | #335 | Tragic 31.1% |
| Yuman | 0.0 /100 | #336 | Tragic 31.5% |
| Houma | 0.0 /100 | #337 | Tragic 32.3% |
| Alaskan Athabascans | 0.0 /100 | #338 | Tragic 32.4% |
| Kiowa | 0.0 /100 | #339 | Tragic 32.6% |
| Lumbee | 0.0 /100 | #340 | Tragic 32.7% |
| Tsimshian | 0.0 /100 | #341 | Tragic 32.9% |
| Pueblo | 0.0 /100 | #342 | Tragic 33.1% |
| Navajo | 0.0 /100 | #343 | Tragic 33.3% |
| Inupiat | 0.0 /100 | #344 | Tragic 34.5% |
| Tohono O'odham | 0.0 /100 | #345 | Tragic 36.0% |
| Yup'ik | 0.0 /100 | #346 | Tragic 37.8% |
| Pima | 0.0 /100 | #347 | Tragic 38.6% |
Demographics Similar to Immigrants from Germany by Disability Age 65 to 74
In terms of disability age 65 to 74, the demographic groups most similar to Immigrants from Germany are Haitian (23.4%, a difference of 0.010%), Immigrants from Eastern Africa (23.4%, a difference of 0.020%), Irish (23.4%, a difference of 0.11%), Assyrian/Chaldean/Syriac (23.4%, a difference of 0.16%), and Scandinavian (23.4%, a difference of 0.18%).
| Demographics | Rating | Rank | Disability Age 65 to 74 |
| Immigrants | Haiti | 47.5 /100 | #177 | Average 23.4% |
| Guyanese | 45.8 /100 | #178 | Average 23.4% |
| Immigrants | Sierra Leone | 45.8 /100 | #179 | Average 23.4% |
| Scandinavians | 45.6 /100 | #180 | Average 23.4% |
| Assyrians/Chaldeans/Syriacs | 45.3 /100 | #181 | Average 23.4% |
| Irish | 44.4 /100 | #182 | Average 23.4% |
| Immigrants | Eastern Africa | 42.8 /100 | #183 | Average 23.4% |
| Immigrants | Germany | 42.5 /100 | #184 | Average 23.4% |
| Haitians | 42.4 /100 | #185 | Average 23.4% |
| Basques | 38.4 /100 | #186 | Fair 23.5% |
| Portuguese | 37.8 /100 | #187 | Fair 23.5% |
| Immigrants | Cuba | 34.0 /100 | #188 | Fair 23.6% |
| Scottish | 33.1 /100 | #189 | Fair 23.6% |
| Immigrants | Guyana | 31.2 /100 | #190 | Fair 23.6% |
| Immigrants | Bangladesh | 30.2 /100 | #191 | Fair 23.6% |