Tsimshian vs Basque Disability Age 65 to 74
COMPARE
Tsimshian
Basque
Disability Age 65 to 74
Disability Age 65 to 74 Comparison
Tsimshian
Basques
32.9%
DISABILITY AGE 65 TO 74
0.0/ 100
METRIC RATING
341st/ 347
METRIC RANK
23.5%
DISABILITY AGE 65 TO 74
38.4/ 100
METRIC RATING
186th/ 347
METRIC RANK
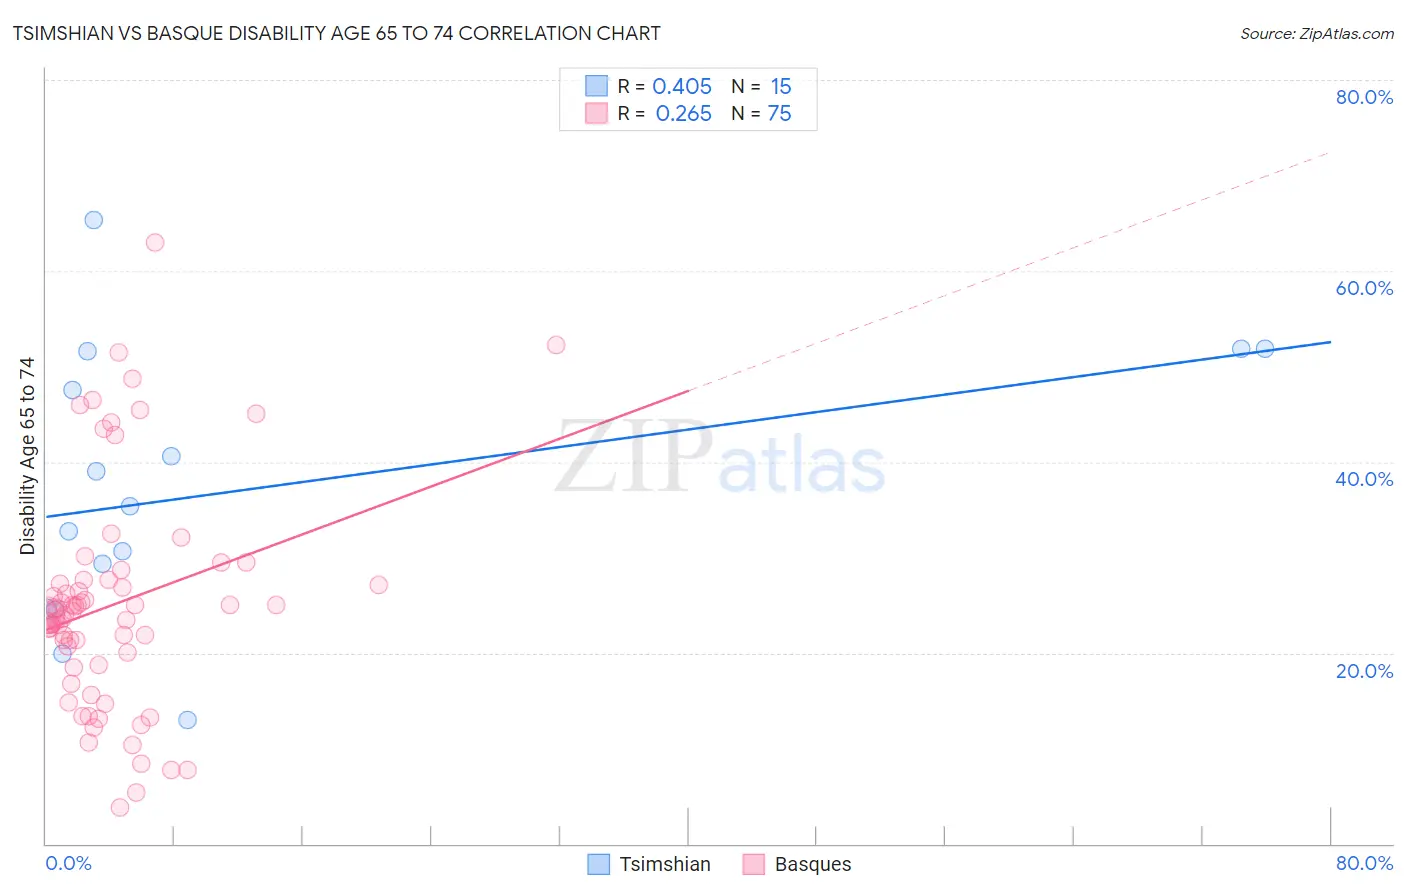
Tsimshian vs Basque Disability Age 65 to 74 Correlation Chart
The statistical analysis conducted on geographies consisting of 15,620,176 people shows a moderate positive correlation between the proportion of Tsimshian and percentage of population with a disability between the ages 65 and 75 in the United States with a correlation coefficient (R) of 0.405 and weighted average of 32.9%. Similarly, the statistical analysis conducted on geographies consisting of 165,654,682 people shows a weak positive correlation between the proportion of Basques and percentage of population with a disability between the ages 65 and 75 in the United States with a correlation coefficient (R) of 0.265 and weighted average of 23.5%, a difference of 40.0%.
Disability Age 65 to 74 Correlation Summary
| Measurement | Tsimshian | Basque |
| Minimum | 13.0% | 3.8% |
| Maximum | 65.3% | 63.0% |
| Range | 52.3% | 59.1% |
| Mean | 37.2% | 25.1% |
| Median | 35.4% | 24.0% |
| Interquartile 25% (IQ1) | 24.6% | 18.7% |
| Interquartile 75% (IQ3) | 51.6% | 27.6% |
| Interquartile Range (IQR) | 27.0% | 8.8% |
| Standard Deviation (Sample) | 14.4% | 11.6% |
| Standard Deviation (Population) | 13.9% | 11.6% |
Similar Demographics by Disability Age 65 to 74
Demographics Similar to Tsimshian by Disability Age 65 to 74
In terms of disability age 65 to 74, the demographic groups most similar to Tsimshian are Lumbee (32.7%, a difference of 0.53%), Pueblo (33.1%, a difference of 0.60%), Kiowa (32.6%, a difference of 1.1%), Navajo (33.3%, a difference of 1.3%), and Alaskan Athabascan (32.4%, a difference of 1.7%).
| Demographics | Rating | Rank | Disability Age 65 to 74 |
| Colville | 0.0 /100 | #333 | Tragic 30.5% |
| Alaska Natives | 0.0 /100 | #334 | Tragic 30.6% |
| Cheyenne | 0.0 /100 | #335 | Tragic 31.1% |
| Yuman | 0.0 /100 | #336 | Tragic 31.5% |
| Houma | 0.0 /100 | #337 | Tragic 32.3% |
| Alaskan Athabascans | 0.0 /100 | #338 | Tragic 32.4% |
| Kiowa | 0.0 /100 | #339 | Tragic 32.6% |
| Lumbee | 0.0 /100 | #340 | Tragic 32.7% |
| Tsimshian | 0.0 /100 | #341 | Tragic 32.9% |
| Pueblo | 0.0 /100 | #342 | Tragic 33.1% |
| Navajo | 0.0 /100 | #343 | Tragic 33.3% |
| Inupiat | 0.0 /100 | #344 | Tragic 34.5% |
| Tohono O'odham | 0.0 /100 | #345 | Tragic 36.0% |
| Yup'ik | 0.0 /100 | #346 | Tragic 37.8% |
| Pima | 0.0 /100 | #347 | Tragic 38.6% |
Demographics Similar to Basques by Disability Age 65 to 74
In terms of disability age 65 to 74, the demographic groups most similar to Basques are Portuguese (23.5%, a difference of 0.040%), Haitian (23.4%, a difference of 0.24%), Immigrants from Germany (23.4%, a difference of 0.25%), Immigrants from Eastern Africa (23.4%, a difference of 0.27%), and Immigrants from Cuba (23.6%, a difference of 0.27%).
| Demographics | Rating | Rank | Disability Age 65 to 74 |
| Immigrants | Sierra Leone | 45.8 /100 | #179 | Average 23.4% |
| Scandinavians | 45.6 /100 | #180 | Average 23.4% |
| Assyrians/Chaldeans/Syriacs | 45.3 /100 | #181 | Average 23.4% |
| Irish | 44.4 /100 | #182 | Average 23.4% |
| Immigrants | Eastern Africa | 42.8 /100 | #183 | Average 23.4% |
| Immigrants | Germany | 42.5 /100 | #184 | Average 23.4% |
| Haitians | 42.4 /100 | #185 | Average 23.4% |
| Basques | 38.4 /100 | #186 | Fair 23.5% |
| Portuguese | 37.8 /100 | #187 | Fair 23.5% |
| Immigrants | Cuba | 34.0 /100 | #188 | Fair 23.6% |
| Scottish | 33.1 /100 | #189 | Fair 23.6% |
| Immigrants | Guyana | 31.2 /100 | #190 | Fair 23.6% |
| Immigrants | Bangladesh | 30.2 /100 | #191 | Fair 23.6% |
| Ecuadorians | 29.7 /100 | #192 | Fair 23.6% |
| English | 28.5 /100 | #193 | Fair 23.6% |