Trinidadian and Tobagonian vs Colville Male Disability
COMPARE
Trinidadian and Tobagonian
Colville
Male Disability
Male Disability Comparison
Trinidadians and Tobagonians
Colville
11.0%
MALE DISABILITY
83.3/ 100
METRIC RATING
135th/ 347
METRIC RANK
16.5%
MALE DISABILITY
0.0/ 100
METRIC RATING
346th/ 347
METRIC RANK
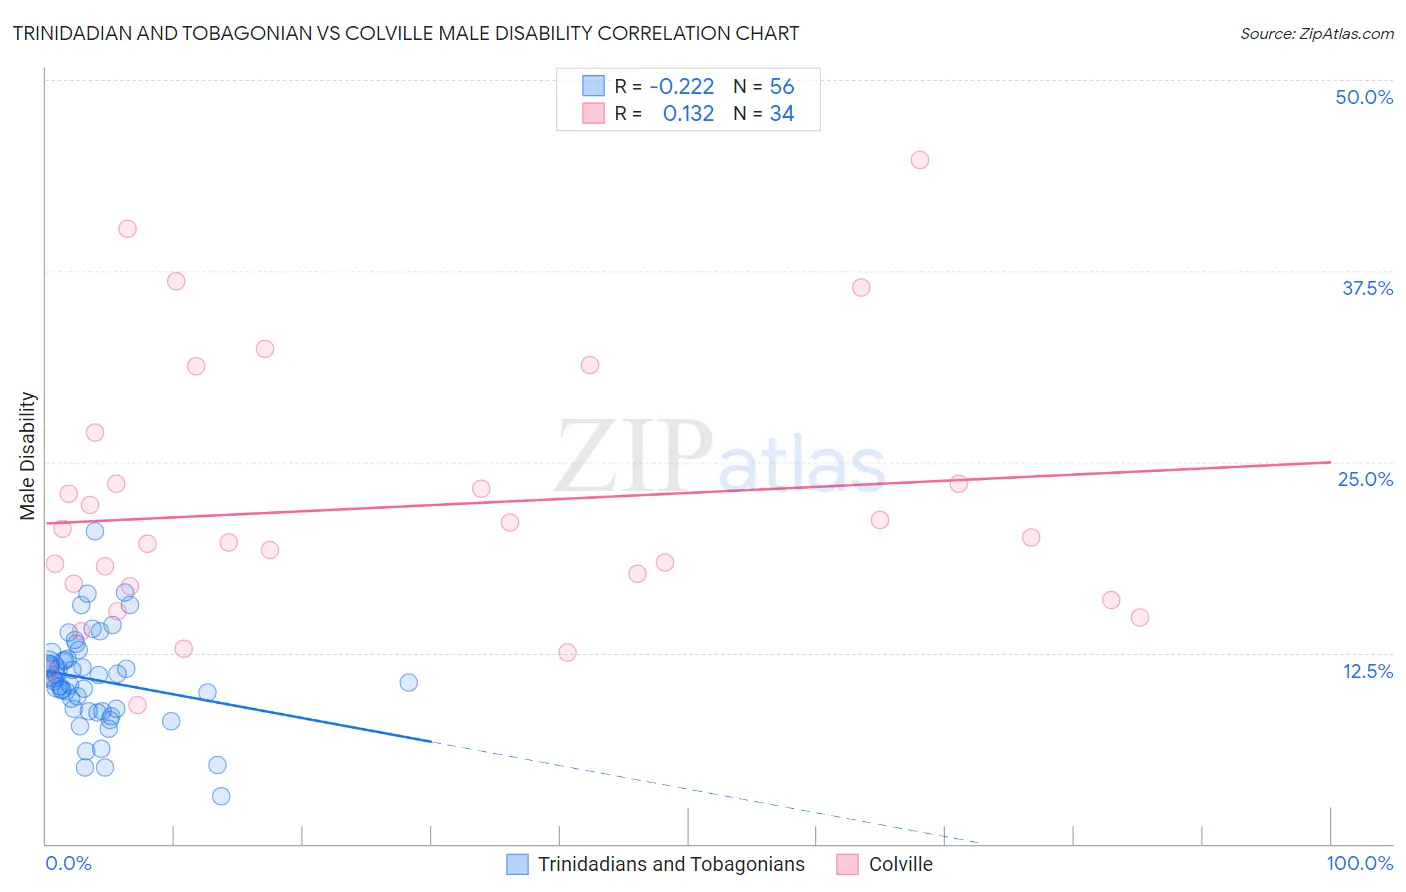
Trinidadian and Tobagonian vs Colville Male Disability Correlation Chart
The statistical analysis conducted on geographies consisting of 219,818,350 people shows a weak negative correlation between the proportion of Trinidadians and Tobagonians and percentage of males with a disability in the United States with a correlation coefficient (R) of -0.222 and weighted average of 11.0%. Similarly, the statistical analysis conducted on geographies consisting of 34,678,900 people shows a poor positive correlation between the proportion of Colville and percentage of males with a disability in the United States with a correlation coefficient (R) of 0.132 and weighted average of 16.5%, a difference of 50.5%.
Male Disability Correlation Summary
| Measurement | Trinidadian and Tobagonian | Colville |
| Minimum | 3.1% | 9.1% |
| Maximum | 20.5% | 44.7% |
| Range | 17.4% | 35.6% |
| Mean | 10.7% | 22.0% |
| Median | 10.8% | 19.9% |
| Interquartile 25% (IQ1) | 8.8% | 16.9% |
| Interquartile 75% (IQ3) | 12.1% | 23.6% |
| Interquartile Range (IQR) | 3.3% | 6.7% |
| Standard Deviation (Sample) | 3.1% | 8.5% |
| Standard Deviation (Population) | 3.1% | 8.4% |
Similar Demographics by Male Disability
Demographics Similar to Trinidadians and Tobagonians by Male Disability
In terms of male disability, the demographic groups most similar to Trinidadians and Tobagonians are Bhutanese (11.0%, a difference of 0.010%), Immigrants from Costa Rica (11.0%, a difference of 0.040%), Ugandan (11.0%, a difference of 0.070%), Immigrants from Fiji (11.0%, a difference of 0.080%), and Macedonian (11.0%, a difference of 0.10%).
| Demographics | Rating | Rank | Male Disability |
| Immigrants | Latvia | 85.5 /100 | #128 | Excellent 10.9% |
| Immigrants | Philippines | 85.4 /100 | #129 | Excellent 10.9% |
| Brazilians | 85.4 /100 | #130 | Excellent 10.9% |
| Macedonians | 84.2 /100 | #131 | Excellent 11.0% |
| Immigrants | Fiji | 84.0 /100 | #132 | Excellent 11.0% |
| Ugandans | 83.9 /100 | #133 | Excellent 11.0% |
| Bhutanese | 83.4 /100 | #134 | Excellent 11.0% |
| Trinidadians and Tobagonians | 83.3 /100 | #135 | Excellent 11.0% |
| Immigrants | Costa Rica | 82.8 /100 | #136 | Excellent 11.0% |
| Immigrants | Europe | 82.0 /100 | #137 | Excellent 11.0% |
| Nigerians | 81.9 /100 | #138 | Excellent 11.0% |
| South Africans | 81.7 /100 | #139 | Excellent 11.0% |
| Immigrants | Italy | 81.5 /100 | #140 | Excellent 11.0% |
| Arabs | 81.5 /100 | #141 | Excellent 11.0% |
| Immigrants | Sudan | 81.5 /100 | #142 | Excellent 11.0% |
Demographics Similar to Colville by Male Disability
In terms of male disability, the demographic groups most similar to Colville are Houma (17.4%, a difference of 5.7%), Tsimshian (15.6%, a difference of 5.8%), Puerto Rican (15.6%, a difference of 6.1%), Creek (15.5%, a difference of 6.2%), and Kiowa (15.4%, a difference of 7.0%).
| Demographics | Rating | Rank | Male Disability |
| Yuman | 0.0 /100 | #333 | Tragic 14.7% |
| Cherokee | 0.0 /100 | #334 | Tragic 14.8% |
| Dutch West Indians | 0.0 /100 | #335 | Tragic 14.8% |
| Alaskan Athabascans | 0.0 /100 | #336 | Tragic 14.9% |
| Menominee | 0.0 /100 | #337 | Tragic 15.0% |
| Pueblo | 0.0 /100 | #338 | Tragic 15.0% |
| Chickasaw | 0.0 /100 | #339 | Tragic 15.1% |
| Lumbee | 0.0 /100 | #340 | Tragic 15.2% |
| Choctaw | 0.0 /100 | #341 | Tragic 15.4% |
| Kiowa | 0.0 /100 | #342 | Tragic 15.4% |
| Creek | 0.0 /100 | #343 | Tragic 15.5% |
| Puerto Ricans | 0.0 /100 | #344 | Tragic 15.6% |
| Tsimshian | 0.0 /100 | #345 | Tragic 15.6% |
| Colville | 0.0 /100 | #346 | Tragic 16.5% |
| Houma | 0.0 /100 | #347 | Tragic 17.4% |