Immigrants from Zimbabwe vs Colville Male Disability
COMPARE
Immigrants from Zimbabwe
Colville
Male Disability
Male Disability Comparison
Immigrants from Zimbabwe
Colville
10.8%
MALE DISABILITY
93.0/ 100
METRIC RATING
113th/ 347
METRIC RANK
16.5%
MALE DISABILITY
0.0/ 100
METRIC RATING
346th/ 347
METRIC RANK
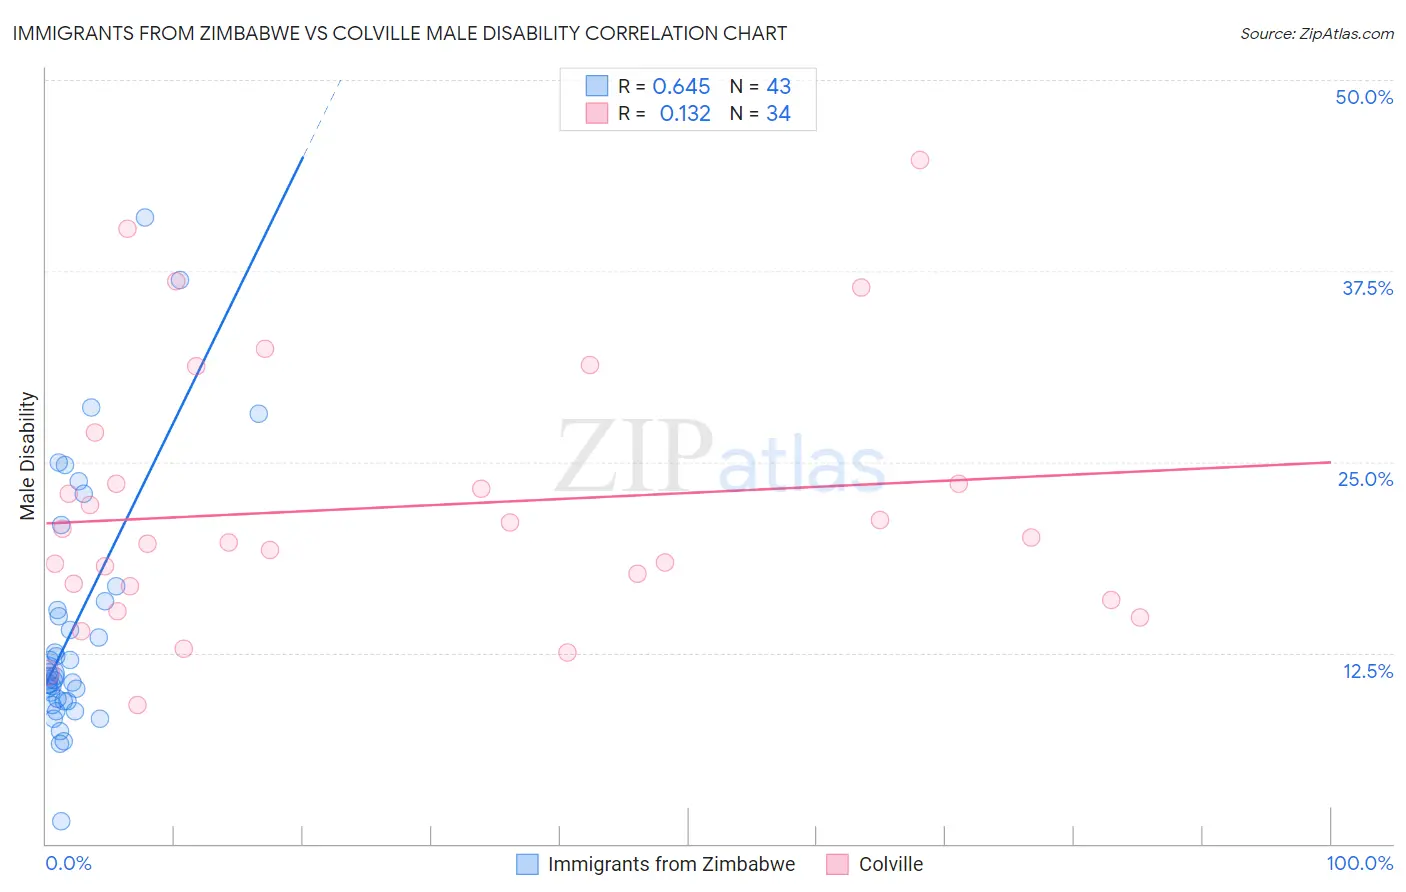
Immigrants from Zimbabwe vs Colville Male Disability Correlation Chart
The statistical analysis conducted on geographies consisting of 117,811,453 people shows a significant positive correlation between the proportion of Immigrants from Zimbabwe and percentage of males with a disability in the United States with a correlation coefficient (R) of 0.645 and weighted average of 10.8%. Similarly, the statistical analysis conducted on geographies consisting of 34,678,900 people shows a poor positive correlation between the proportion of Colville and percentage of males with a disability in the United States with a correlation coefficient (R) of 0.132 and weighted average of 16.5%, a difference of 52.6%.
Male Disability Correlation Summary
| Measurement | Immigrants from Zimbabwe | Colville |
| Minimum | 1.5% | 9.1% |
| Maximum | 41.0% | 44.7% |
| Range | 39.5% | 35.6% |
| Mean | 14.2% | 22.0% |
| Median | 11.0% | 19.9% |
| Interquartile 25% (IQ1) | 9.4% | 16.9% |
| Interquartile 75% (IQ3) | 15.9% | 23.6% |
| Interquartile Range (IQR) | 6.5% | 6.7% |
| Standard Deviation (Sample) | 8.2% | 8.5% |
| Standard Deviation (Population) | 8.1% | 8.4% |
Similar Demographics by Male Disability
Demographics Similar to Immigrants from Zimbabwe by Male Disability
In terms of male disability, the demographic groups most similar to Immigrants from Zimbabwe are Central American (10.8%, a difference of 0.070%), Ghanaian (10.8%, a difference of 0.090%), Immigrants from Barbados (10.8%, a difference of 0.16%), Immigrants from Uruguay (10.8%, a difference of 0.18%), and Immigrants (10.8%, a difference of 0.22%).
| Demographics | Rating | Rank | Male Disability |
| Immigrants | Syria | 94.9 /100 | #106 | Exceptional 10.8% |
| Immigrants | Eastern Africa | 94.3 /100 | #107 | Exceptional 10.8% |
| Immigrants | Belgium | 94.2 /100 | #108 | Exceptional 10.8% |
| Immigrants | Uganda | 94.0 /100 | #109 | Exceptional 10.8% |
| Immigrants | Immigrants | 93.9 /100 | #110 | Exceptional 10.8% |
| Immigrants | Uruguay | 93.8 /100 | #111 | Exceptional 10.8% |
| Ghanaians | 93.4 /100 | #112 | Exceptional 10.8% |
| Immigrants | Zimbabwe | 93.0 /100 | #113 | Exceptional 10.8% |
| Central Americans | 92.7 /100 | #114 | Exceptional 10.8% |
| Immigrants | Barbados | 92.2 /100 | #115 | Exceptional 10.8% |
| Immigrants | South Africa | 91.8 /100 | #116 | Exceptional 10.8% |
| Eastern Europeans | 90.6 /100 | #117 | Exceptional 10.9% |
| Immigrants | Cuba | 90.2 /100 | #118 | Exceptional 10.9% |
| Armenians | 90.1 /100 | #119 | Exceptional 10.9% |
| Immigrants | Africa | 89.4 /100 | #120 | Excellent 10.9% |
Demographics Similar to Colville by Male Disability
In terms of male disability, the demographic groups most similar to Colville are Houma (17.4%, a difference of 5.7%), Tsimshian (15.6%, a difference of 5.8%), Puerto Rican (15.6%, a difference of 6.1%), Creek (15.5%, a difference of 6.2%), and Kiowa (15.4%, a difference of 7.0%).
| Demographics | Rating | Rank | Male Disability |
| Yuman | 0.0 /100 | #333 | Tragic 14.7% |
| Cherokee | 0.0 /100 | #334 | Tragic 14.8% |
| Dutch West Indians | 0.0 /100 | #335 | Tragic 14.8% |
| Alaskan Athabascans | 0.0 /100 | #336 | Tragic 14.9% |
| Menominee | 0.0 /100 | #337 | Tragic 15.0% |
| Pueblo | 0.0 /100 | #338 | Tragic 15.0% |
| Chickasaw | 0.0 /100 | #339 | Tragic 15.1% |
| Lumbee | 0.0 /100 | #340 | Tragic 15.2% |
| Choctaw | 0.0 /100 | #341 | Tragic 15.4% |
| Kiowa | 0.0 /100 | #342 | Tragic 15.4% |
| Creek | 0.0 /100 | #343 | Tragic 15.5% |
| Puerto Ricans | 0.0 /100 | #344 | Tragic 15.6% |
| Tsimshian | 0.0 /100 | #345 | Tragic 15.6% |
| Colville | 0.0 /100 | #346 | Tragic 16.5% |
| Houma | 0.0 /100 | #347 | Tragic 17.4% |