Immigrants from Eritrea vs Colville Male Disability
COMPARE
Immigrants from Eritrea
Colville
Male Disability
Male Disability Comparison
Immigrants from Eritrea
Colville
10.4%
MALE DISABILITY
99.6/ 100
METRIC RATING
55th/ 347
METRIC RANK
16.5%
MALE DISABILITY
0.0/ 100
METRIC RATING
346th/ 347
METRIC RANK
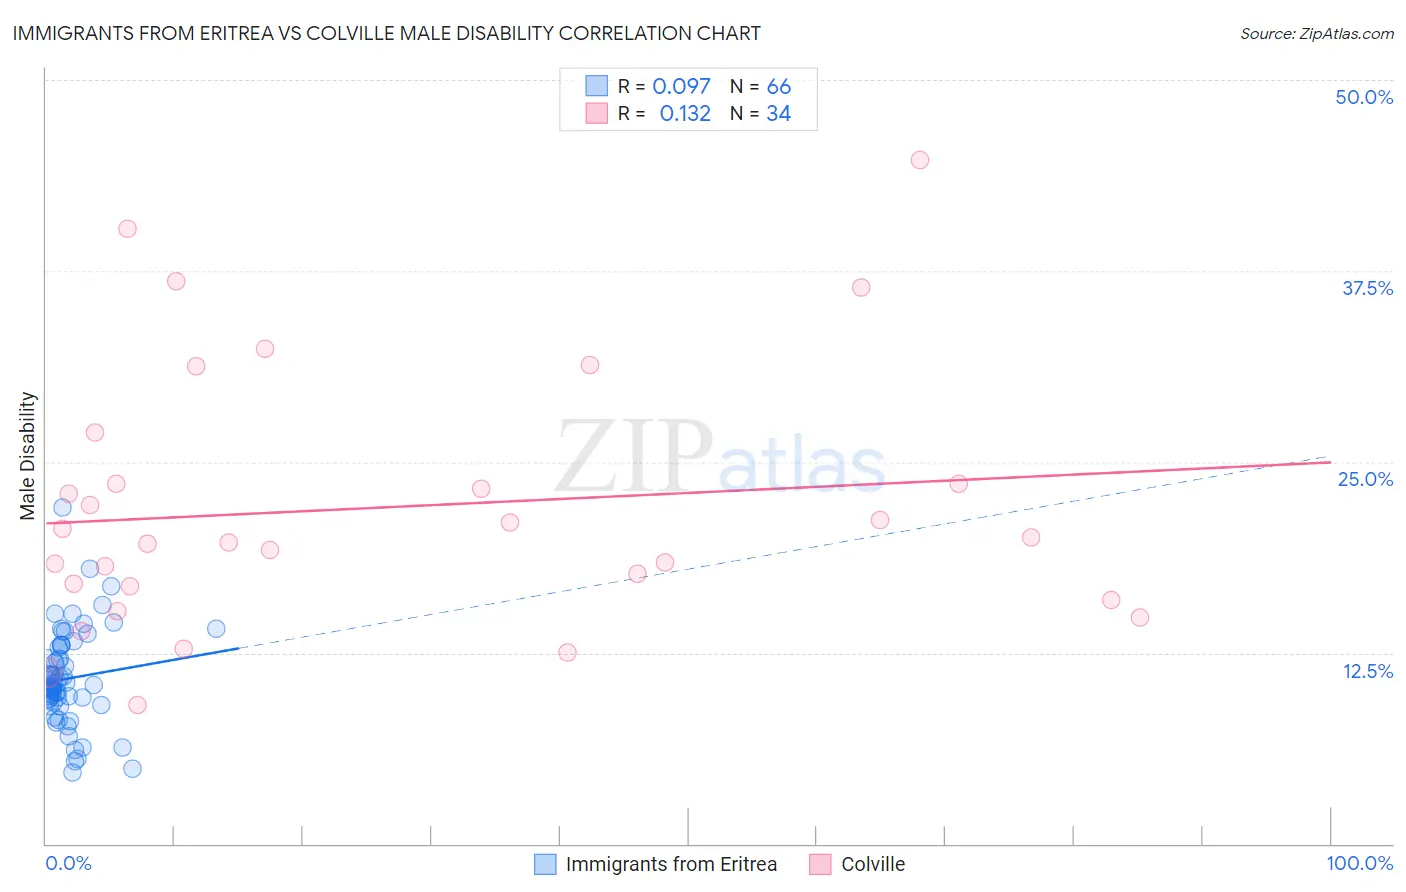
Immigrants from Eritrea vs Colville Male Disability Correlation Chart
The statistical analysis conducted on geographies consisting of 104,852,788 people shows a slight positive correlation between the proportion of Immigrants from Eritrea and percentage of males with a disability in the United States with a correlation coefficient (R) of 0.097 and weighted average of 10.4%. Similarly, the statistical analysis conducted on geographies consisting of 34,678,900 people shows a poor positive correlation between the proportion of Colville and percentage of males with a disability in the United States with a correlation coefficient (R) of 0.132 and weighted average of 16.5%, a difference of 59.2%.
Male Disability Correlation Summary
| Measurement | Immigrants from Eritrea | Colville |
| Minimum | 4.7% | 9.1% |
| Maximum | 22.0% | 44.7% |
| Range | 17.3% | 35.6% |
| Mean | 10.8% | 22.0% |
| Median | 10.4% | 19.9% |
| Interquartile 25% (IQ1) | 9.2% | 16.9% |
| Interquartile 75% (IQ3) | 13.0% | 23.6% |
| Interquartile Range (IQR) | 3.8% | 6.7% |
| Standard Deviation (Sample) | 3.2% | 8.5% |
| Standard Deviation (Population) | 3.1% | 8.4% |
Similar Demographics by Male Disability
Demographics Similar to Immigrants from Eritrea by Male Disability
In terms of male disability, the demographic groups most similar to Immigrants from Eritrea are Peruvian (10.4%, a difference of 0.020%), Tongan (10.4%, a difference of 0.040%), Immigrants from Uzbekistan (10.4%, a difference of 0.060%), Immigrants from South America (10.4%, a difference of 0.060%), and Immigrants from Saudi Arabia (10.4%, a difference of 0.080%).
| Demographics | Rating | Rank | Male Disability |
| Israelis | 99.7 /100 | #48 | Exceptional 10.3% |
| Immigrants | Spain | 99.7 /100 | #49 | Exceptional 10.3% |
| South Americans | 99.6 /100 | #50 | Exceptional 10.3% |
| Salvadorans | 99.6 /100 | #51 | Exceptional 10.4% |
| Immigrants | Saudi Arabia | 99.6 /100 | #52 | Exceptional 10.4% |
| Immigrants | Uzbekistan | 99.6 /100 | #53 | Exceptional 10.4% |
| Peruvians | 99.6 /100 | #54 | Exceptional 10.4% |
| Immigrants | Eritrea | 99.6 /100 | #55 | Exceptional 10.4% |
| Tongans | 99.6 /100 | #56 | Exceptional 10.4% |
| Immigrants | South America | 99.6 /100 | #57 | Exceptional 10.4% |
| Immigrants | Japan | 99.5 /100 | #58 | Exceptional 10.4% |
| Immigrants | Australia | 99.5 /100 | #59 | Exceptional 10.4% |
| Immigrants | Colombia | 99.5 /100 | #60 | Exceptional 10.4% |
| Immigrants | Northern Africa | 99.4 /100 | #61 | Exceptional 10.4% |
| Immigrants | Ecuador | 99.3 /100 | #62 | Exceptional 10.4% |
Demographics Similar to Colville by Male Disability
In terms of male disability, the demographic groups most similar to Colville are Houma (17.4%, a difference of 5.7%), Tsimshian (15.6%, a difference of 5.8%), Puerto Rican (15.6%, a difference of 6.1%), Creek (15.5%, a difference of 6.2%), and Kiowa (15.4%, a difference of 7.0%).
| Demographics | Rating | Rank | Male Disability |
| Yuman | 0.0 /100 | #333 | Tragic 14.7% |
| Cherokee | 0.0 /100 | #334 | Tragic 14.8% |
| Dutch West Indians | 0.0 /100 | #335 | Tragic 14.8% |
| Alaskan Athabascans | 0.0 /100 | #336 | Tragic 14.9% |
| Menominee | 0.0 /100 | #337 | Tragic 15.0% |
| Pueblo | 0.0 /100 | #338 | Tragic 15.0% |
| Chickasaw | 0.0 /100 | #339 | Tragic 15.1% |
| Lumbee | 0.0 /100 | #340 | Tragic 15.2% |
| Choctaw | 0.0 /100 | #341 | Tragic 15.4% |
| Kiowa | 0.0 /100 | #342 | Tragic 15.4% |
| Creek | 0.0 /100 | #343 | Tragic 15.5% |
| Puerto Ricans | 0.0 /100 | #344 | Tragic 15.6% |
| Tsimshian | 0.0 /100 | #345 | Tragic 15.6% |
| Colville | 0.0 /100 | #346 | Tragic 16.5% |
| Houma | 0.0 /100 | #347 | Tragic 17.4% |