Trinidadian and Tobagonian vs Colville Single Mother Poverty
COMPARE
Trinidadian and Tobagonian
Colville
Single Mother Poverty
Single Mother Poverty Comparison
Trinidadians and Tobagonians
Colville
29.6%
SINGLE MOTHER POVERTY
21.7/ 100
METRIC RATING
198th/ 347
METRIC RANK
39.3%
SINGLE MOTHER POVERTY
0.0/ 100
METRIC RATING
341st/ 347
METRIC RANK
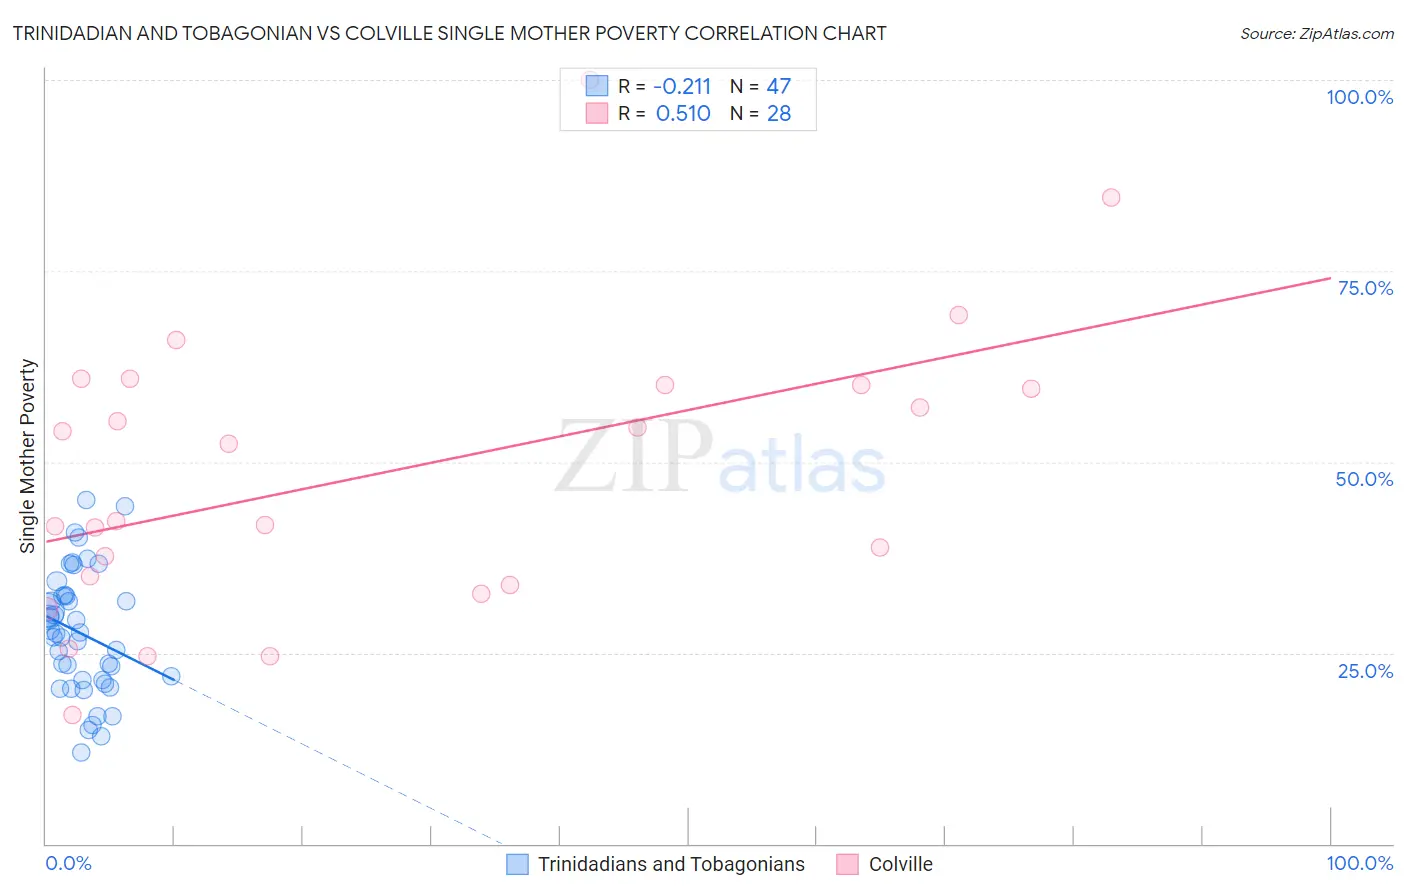
Trinidadian and Tobagonian vs Colville Single Mother Poverty Correlation Chart
The statistical analysis conducted on geographies consisting of 216,680,407 people shows a weak negative correlation between the proportion of Trinidadians and Tobagonians and poverty level among single mothers in the United States with a correlation coefficient (R) of -0.211 and weighted average of 29.6%. Similarly, the statistical analysis conducted on geographies consisting of 34,541,022 people shows a substantial positive correlation between the proportion of Colville and poverty level among single mothers in the United States with a correlation coefficient (R) of 0.510 and weighted average of 39.3%, a difference of 32.7%.
Single Mother Poverty Correlation Summary
| Measurement | Trinidadian and Tobagonian | Colville |
| Minimum | 12.0% | 16.8% |
| Maximum | 45.0% | 100.0% |
| Range | 33.0% | 83.2% |
| Mean | 27.6% | 48.6% |
| Median | 27.5% | 47.3% |
| Interquartile 25% (IQ1) | 21.4% | 34.5% |
| Interquartile 75% (IQ3) | 32.5% | 60.0% |
| Interquartile Range (IQR) | 11.1% | 25.5% |
| Standard Deviation (Sample) | 8.0% | 18.9% |
| Standard Deviation (Population) | 7.9% | 18.5% |
Similar Demographics by Single Mother Poverty
Demographics Similar to Trinidadians and Tobagonians by Single Mother Poverty
In terms of single mother poverty, the demographic groups most similar to Trinidadians and Tobagonians are Immigrants from Jamaica (29.6%, a difference of 0.020%), Cuban (29.6%, a difference of 0.070%), Spanish American Indian (29.6%, a difference of 0.11%), Panamanian (29.6%, a difference of 0.12%), and Slavic (29.6%, a difference of 0.18%).
| Demographics | Rating | Rank | Single Mother Poverty |
| Immigrants | Trinidad and Tobago | 29.2 /100 | #191 | Fair 29.5% |
| Moroccans | 28.6 /100 | #192 | Fair 29.5% |
| Basques | 28.3 /100 | #193 | Fair 29.5% |
| Icelanders | 26.1 /100 | #194 | Fair 29.5% |
| Slavs | 24.5 /100 | #195 | Fair 29.6% |
| Spanish American Indians | 23.4 /100 | #196 | Fair 29.6% |
| Immigrants | Jamaica | 22.0 /100 | #197 | Fair 29.6% |
| Trinidadians and Tobagonians | 21.7 /100 | #198 | Fair 29.6% |
| Cubans | 20.8 /100 | #199 | Fair 29.6% |
| Panamanians | 20.0 /100 | #200 | Fair 29.6% |
| Belgians | 18.8 /100 | #201 | Poor 29.7% |
| Malaysians | 17.4 /100 | #202 | Poor 29.7% |
| Swiss | 17.2 /100 | #203 | Poor 29.7% |
| Immigrants | Immigrants | 16.6 /100 | #204 | Poor 29.7% |
| Czechoslovakians | 16.1 /100 | #205 | Poor 29.7% |
Demographics Similar to Colville by Single Mother Poverty
In terms of single mother poverty, the demographic groups most similar to Colville are Sioux (38.8%, a difference of 1.3%), Crow (38.6%, a difference of 1.7%), Pima (38.6%, a difference of 1.8%), Immigrants from Yemen (38.5%, a difference of 2.0%), and Cheyenne (38.5%, a difference of 2.1%).
| Demographics | Rating | Rank | Single Mother Poverty |
| Menominee | 0.0 /100 | #333 | Tragic 37.1% |
| Pueblo | 0.0 /100 | #334 | Tragic 37.2% |
| Yuman | 0.0 /100 | #335 | Tragic 37.8% |
| Cheyenne | 0.0 /100 | #336 | Tragic 38.5% |
| Immigrants | Yemen | 0.0 /100 | #337 | Tragic 38.5% |
| Pima | 0.0 /100 | #338 | Tragic 38.6% |
| Crow | 0.0 /100 | #339 | Tragic 38.6% |
| Sioux | 0.0 /100 | #340 | Tragic 38.8% |
| Colville | 0.0 /100 | #341 | Tragic 39.3% |
| Navajo | 0.0 /100 | #342 | Tragic 40.2% |
| Cajuns | 0.0 /100 | #343 | Tragic 40.3% |
| Tohono O'odham | 0.0 /100 | #344 | Tragic 43.0% |
| Lumbee | 0.0 /100 | #345 | Tragic 43.2% |
| Houma | 0.0 /100 | #346 | Tragic 43.5% |
| Puerto Ricans | 0.0 /100 | #347 | Tragic 44.5% |