Trinidadian and Tobagonian vs Australian Male Disability
COMPARE
Trinidadian and Tobagonian
Australian
Male Disability
Male Disability Comparison
Trinidadians and Tobagonians
Australians
11.0%
MALE DISABILITY
83.3/ 100
METRIC RATING
135th/ 347
METRIC RANK
11.3%
MALE DISABILITY
42.2/ 100
METRIC RATING
178th/ 347
METRIC RANK
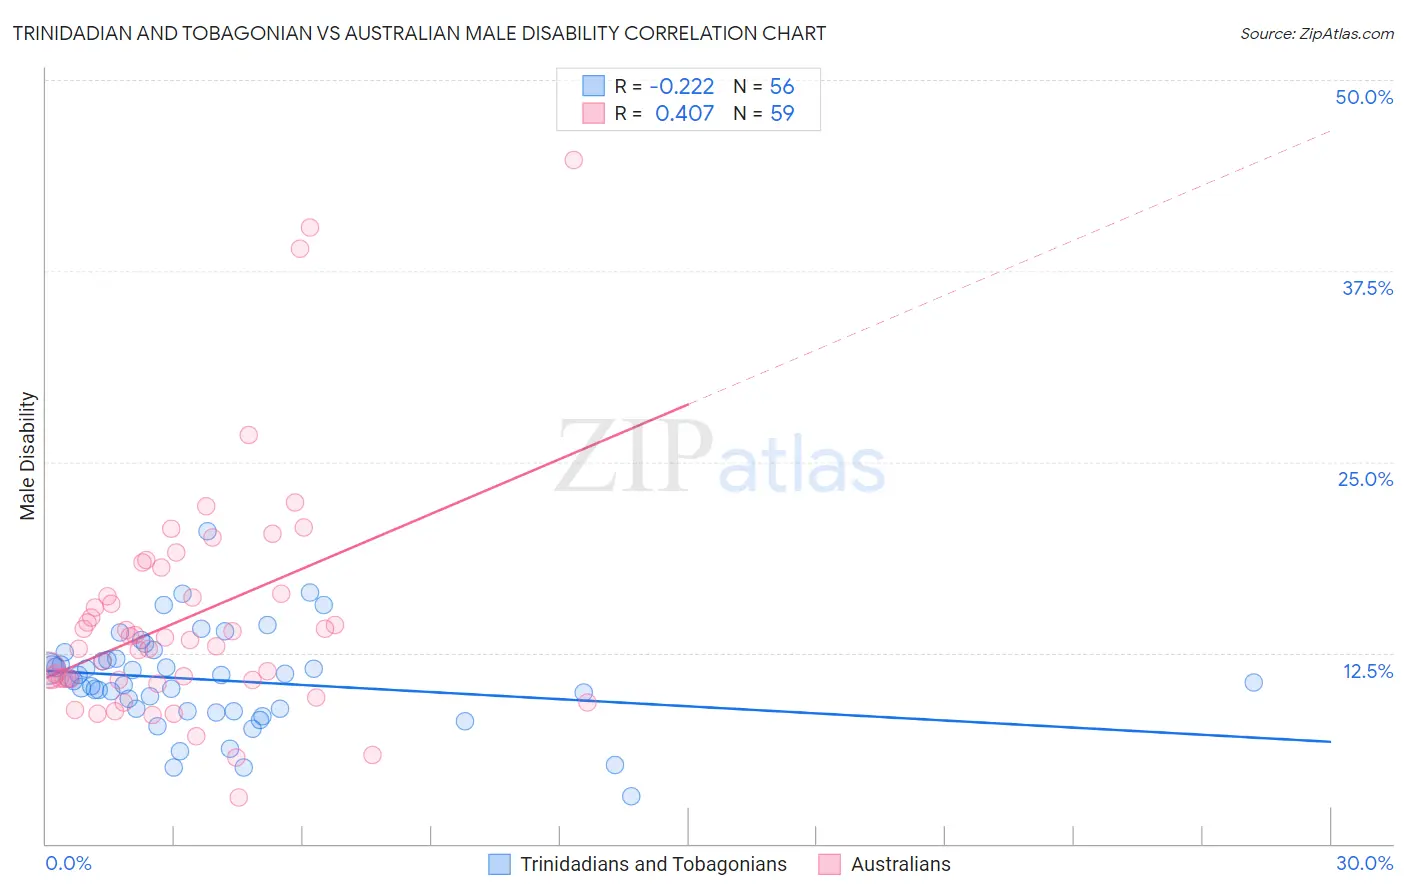
Trinidadian and Tobagonian vs Australian Male Disability Correlation Chart
The statistical analysis conducted on geographies consisting of 219,818,350 people shows a weak negative correlation between the proportion of Trinidadians and Tobagonians and percentage of males with a disability in the United States with a correlation coefficient (R) of -0.222 and weighted average of 11.0%. Similarly, the statistical analysis conducted on geographies consisting of 224,140,588 people shows a moderate positive correlation between the proportion of Australians and percentage of males with a disability in the United States with a correlation coefficient (R) of 0.407 and weighted average of 11.3%, a difference of 2.7%.
Male Disability Correlation Summary
| Measurement | Trinidadian and Tobagonian | Australian |
| Minimum | 3.1% | 3.0% |
| Maximum | 20.5% | 44.7% |
| Range | 17.4% | 41.7% |
| Mean | 10.7% | 14.8% |
| Median | 10.8% | 13.3% |
| Interquartile 25% (IQ1) | 8.8% | 10.8% |
| Interquartile 75% (IQ3) | 12.1% | 16.4% |
| Interquartile Range (IQR) | 3.3% | 5.6% |
| Standard Deviation (Sample) | 3.1% | 7.7% |
| Standard Deviation (Population) | 3.1% | 7.6% |
Similar Demographics by Male Disability
Demographics Similar to Trinidadians and Tobagonians by Male Disability
In terms of male disability, the demographic groups most similar to Trinidadians and Tobagonians are Bhutanese (11.0%, a difference of 0.010%), Immigrants from Costa Rica (11.0%, a difference of 0.040%), Ugandan (11.0%, a difference of 0.070%), Immigrants from Fiji (11.0%, a difference of 0.080%), and Macedonian (11.0%, a difference of 0.10%).
| Demographics | Rating | Rank | Male Disability |
| Immigrants | Latvia | 85.5 /100 | #128 | Excellent 10.9% |
| Immigrants | Philippines | 85.4 /100 | #129 | Excellent 10.9% |
| Brazilians | 85.4 /100 | #130 | Excellent 10.9% |
| Macedonians | 84.2 /100 | #131 | Excellent 11.0% |
| Immigrants | Fiji | 84.0 /100 | #132 | Excellent 11.0% |
| Ugandans | 83.9 /100 | #133 | Excellent 11.0% |
| Bhutanese | 83.4 /100 | #134 | Excellent 11.0% |
| Trinidadians and Tobagonians | 83.3 /100 | #135 | Excellent 11.0% |
| Immigrants | Costa Rica | 82.8 /100 | #136 | Excellent 11.0% |
| Immigrants | Europe | 82.0 /100 | #137 | Excellent 11.0% |
| Nigerians | 81.9 /100 | #138 | Excellent 11.0% |
| South Africans | 81.7 /100 | #139 | Excellent 11.0% |
| Immigrants | Italy | 81.5 /100 | #140 | Excellent 11.0% |
| Arabs | 81.5 /100 | #141 | Excellent 11.0% |
| Immigrants | Sudan | 81.5 /100 | #142 | Excellent 11.0% |
Demographics Similar to Australians by Male Disability
In terms of male disability, the demographic groups most similar to Australians are Immigrants from Caribbean (11.3%, a difference of 0.040%), Honduran (11.3%, a difference of 0.060%), Immigrants from Norway (11.3%, a difference of 0.11%), Syrian (11.2%, a difference of 0.24%), and Immigrants from Honduras (11.2%, a difference of 0.36%).
| Demographics | Rating | Rank | Male Disability |
| Haitians | 52.5 /100 | #171 | Average 11.2% |
| Romanians | 50.7 /100 | #172 | Average 11.2% |
| Immigrants | Burma/Myanmar | 50.4 /100 | #173 | Average 11.2% |
| Maltese | 50.0 /100 | #174 | Average 11.2% |
| Immigrants | Honduras | 48.7 /100 | #175 | Average 11.2% |
| Syrians | 46.6 /100 | #176 | Average 11.2% |
| Immigrants | Norway | 44.2 /100 | #177 | Average 11.3% |
| Australians | 42.2 /100 | #178 | Average 11.3% |
| Immigrants | Caribbean | 41.4 /100 | #179 | Average 11.3% |
| Hondurans | 41.1 /100 | #180 | Average 11.3% |
| Immigrants | Senegal | 34.4 /100 | #181 | Fair 11.3% |
| Immigrants | Belize | 33.7 /100 | #182 | Fair 11.3% |
| Immigrants | Central America | 32.9 /100 | #183 | Fair 11.3% |
| Iraqis | 30.5 /100 | #184 | Fair 11.3% |
| Pakistanis | 30.3 /100 | #185 | Fair 11.3% |