Tongan vs Immigrants from Sudan Ambulatory Disability
COMPARE
Tongan
Immigrants from Sudan
Ambulatory Disability
Ambulatory Disability Comparison
Tongans
Immigrants from Sudan
5.4%
AMBULATORY DISABILITY
100.0/ 100
METRIC RATING
23rd/ 347
METRIC RANK
5.8%
AMBULATORY DISABILITY
98.8/ 100
METRIC RATING
91st/ 347
METRIC RANK
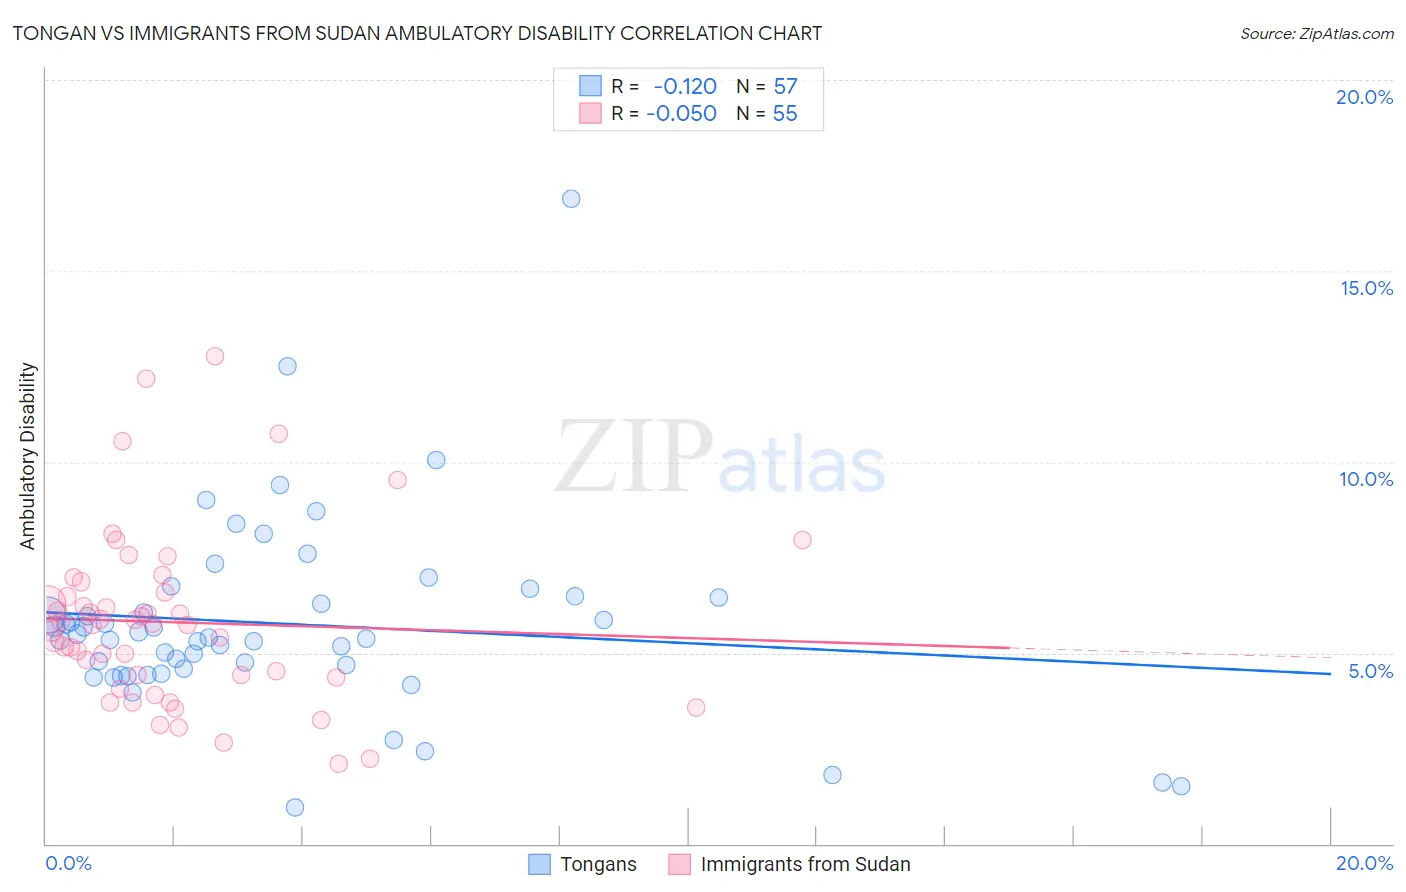
Tongan vs Immigrants from Sudan Ambulatory Disability Correlation Chart
The statistical analysis conducted on geographies consisting of 102,876,651 people shows a poor negative correlation between the proportion of Tongans and percentage of population with ambulatory disability in the United States with a correlation coefficient (R) of -0.120 and weighted average of 5.4%. Similarly, the statistical analysis conducted on geographies consisting of 118,955,409 people shows a slight negative correlation between the proportion of Immigrants from Sudan and percentage of population with ambulatory disability in the United States with a correlation coefficient (R) of -0.050 and weighted average of 5.8%, a difference of 7.0%.
Ambulatory Disability Correlation Summary
| Measurement | Tongan | Immigrants from Sudan |
| Minimum | 0.94% | 2.1% |
| Maximum | 16.9% | 12.8% |
| Range | 16.0% | 10.7% |
| Mean | 5.8% | 5.8% |
| Median | 5.4% | 5.7% |
| Interquartile 25% (IQ1) | 4.5% | 4.3% |
| Interquartile 75% (IQ3) | 6.5% | 6.6% |
| Interquartile Range (IQR) | 1.9% | 2.2% |
| Standard Deviation (Sample) | 2.5% | 2.3% |
| Standard Deviation (Population) | 2.5% | 2.2% |
Similar Demographics by Ambulatory Disability
Demographics Similar to Tongans by Ambulatory Disability
In terms of ambulatory disability, the demographic groups most similar to Tongans are Immigrants from Israel (5.4%, a difference of 0.040%), Immigrants from Saudi Arabia (5.4%, a difference of 0.090%), Zimbabwean (5.4%, a difference of 0.17%), Immigrants from Nepal (5.4%, a difference of 0.20%), and Asian (5.4%, a difference of 0.36%).
| Demographics | Rating | Rank | Ambulatory Disability |
| Immigrants | Hong Kong | 100.0 /100 | #16 | Exceptional 5.3% |
| Immigrants | Ethiopia | 100.0 /100 | #17 | Exceptional 5.4% |
| Immigrants | Sri Lanka | 100.0 /100 | #18 | Exceptional 5.4% |
| Indians (Asian) | 100.0 /100 | #19 | Exceptional 5.4% |
| Ethiopians | 100.0 /100 | #20 | Exceptional 5.4% |
| Immigrants | Kuwait | 100.0 /100 | #21 | Exceptional 5.4% |
| Immigrants | Israel | 100.0 /100 | #22 | Exceptional 5.4% |
| Tongans | 100.0 /100 | #23 | Exceptional 5.4% |
| Immigrants | Saudi Arabia | 100.0 /100 | #24 | Exceptional 5.4% |
| Zimbabweans | 100.0 /100 | #25 | Exceptional 5.4% |
| Immigrants | Nepal | 100.0 /100 | #26 | Exceptional 5.4% |
| Asians | 100.0 /100 | #27 | Exceptional 5.4% |
| Cambodians | 100.0 /100 | #28 | Exceptional 5.4% |
| Immigrants | Iran | 100.0 /100 | #29 | Exceptional 5.4% |
| Immigrants | Turkey | 100.0 /100 | #30 | Exceptional 5.4% |
Demographics Similar to Immigrants from Sudan by Ambulatory Disability
In terms of ambulatory disability, the demographic groups most similar to Immigrants from Sudan are Bhutanese (5.8%, a difference of 0.0%), Australian (5.8%, a difference of 0.0%), Soviet Union (5.8%, a difference of 0.12%), Immigrants from Chile (5.8%, a difference of 0.17%), and Immigrants from Sierra Leone (5.8%, a difference of 0.17%).
| Demographics | Rating | Rank | Ambulatory Disability |
| Ugandans | 99.2 /100 | #84 | Exceptional 5.7% |
| South Americans | 99.0 /100 | #85 | Exceptional 5.7% |
| Latvians | 99.0 /100 | #86 | Exceptional 5.7% |
| Immigrants | Chile | 98.9 /100 | #87 | Exceptional 5.8% |
| Soviet Union | 98.9 /100 | #88 | Exceptional 5.8% |
| Bhutanese | 98.8 /100 | #89 | Exceptional 5.8% |
| Australians | 98.8 /100 | #90 | Exceptional 5.8% |
| Immigrants | Sudan | 98.8 /100 | #91 | Exceptional 5.8% |
| Immigrants | Sierra Leone | 98.6 /100 | #92 | Exceptional 5.8% |
| Immigrants | Denmark | 98.6 /100 | #93 | Exceptional 5.8% |
| Kenyans | 98.4 /100 | #94 | Exceptional 5.8% |
| Immigrants | El Salvador | 98.4 /100 | #95 | Exceptional 5.8% |
| Salvadorans | 98.4 /100 | #96 | Exceptional 5.8% |
| Immigrants | Somalia | 98.3 /100 | #97 | Exceptional 5.8% |
| Immigrants | Lebanon | 98.3 /100 | #98 | Exceptional 5.8% |