Tohono O'odham vs Israeli Disability Age 5 to 17
COMPARE
Tohono O'odham
Israeli
Disability Age 5 to 17
Disability Age 5 to 17 Comparison
Tohono O'odham
Israelis
6.5%
DISABILITY AGE 5 TO 17
0.0/ 100
METRIC RATING
321st/ 347
METRIC RANK
5.0%
DISABILITY AGE 5 TO 17
100.0/ 100
METRIC RATING
34th/ 347
METRIC RANK
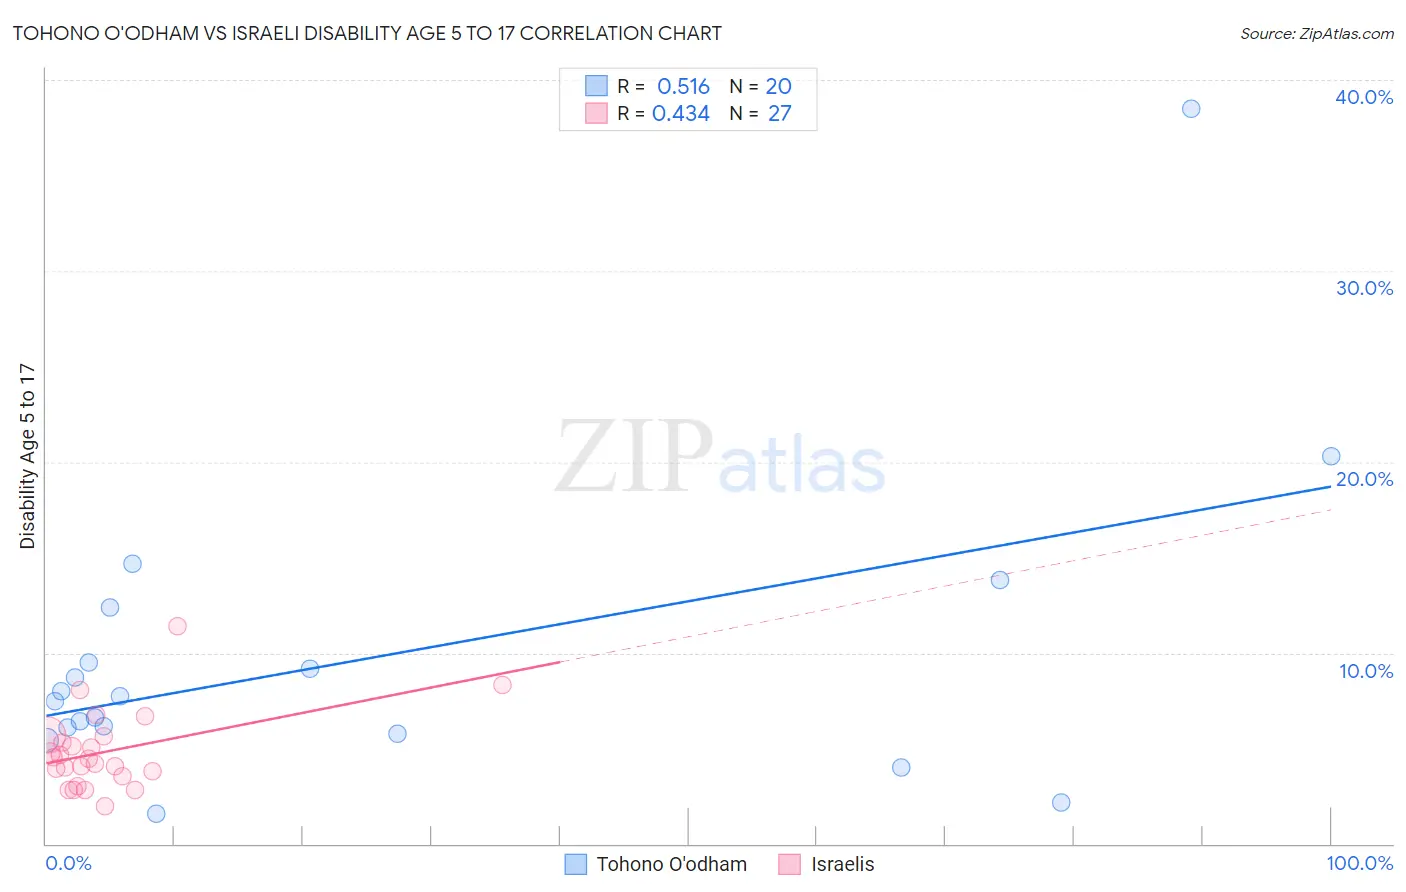
Tohono O'odham vs Israeli Disability Age 5 to 17 Correlation Chart
The statistical analysis conducted on geographies consisting of 58,652,190 people shows a substantial positive correlation between the proportion of Tohono O'odham and percentage of population with a disability between the ages 5 and 17 in the United States with a correlation coefficient (R) of 0.516 and weighted average of 6.5%. Similarly, the statistical analysis conducted on geographies consisting of 209,817,716 people shows a moderate positive correlation between the proportion of Israelis and percentage of population with a disability between the ages 5 and 17 in the United States with a correlation coefficient (R) of 0.434 and weighted average of 5.0%, a difference of 30.5%.
Disability Age 5 to 17 Correlation Summary
| Measurement | Tohono O'odham | Israeli |
| Minimum | 1.6% | 2.0% |
| Maximum | 38.5% | 11.4% |
| Range | 37.0% | 9.5% |
| Mean | 9.7% | 4.8% |
| Median | 7.6% | 4.5% |
| Interquartile 25% (IQ1) | 5.9% | 3.5% |
| Interquartile 75% (IQ3) | 10.9% | 5.7% |
| Interquartile Range (IQR) | 5.0% | 2.1% |
| Standard Deviation (Sample) | 8.1% | 2.0% |
| Standard Deviation (Population) | 7.9% | 2.0% |
Similar Demographics by Disability Age 5 to 17
Demographics Similar to Tohono O'odham by Disability Age 5 to 17
In terms of disability age 5 to 17, the demographic groups most similar to Tohono O'odham are Slovak (6.5%, a difference of 0.020%), Osage (6.5%, a difference of 0.060%), Dominican (6.5%, a difference of 0.14%), American (6.5%, a difference of 0.19%), and Potawatomi (6.5%, a difference of 0.32%).
| Demographics | Rating | Rank | Disability Age 5 to 17 |
| French | 0.0 /100 | #314 | Tragic 6.4% |
| Immigrants | Portugal | 0.0 /100 | #315 | Tragic 6.4% |
| Immigrants | Dominican Republic | 0.0 /100 | #316 | Tragic 6.4% |
| Kiowa | 0.0 /100 | #317 | Tragic 6.4% |
| Comanche | 0.0 /100 | #318 | Tragic 6.4% |
| Delaware | 0.0 /100 | #319 | Tragic 6.5% |
| Africans | 0.0 /100 | #320 | Tragic 6.5% |
| Tohono O'odham | 0.0 /100 | #321 | Tragic 6.5% |
| Slovaks | 0.0 /100 | #322 | Tragic 6.5% |
| Osage | 0.0 /100 | #323 | Tragic 6.5% |
| Dominicans | 0.0 /100 | #324 | Tragic 6.5% |
| Americans | 0.0 /100 | #325 | Tragic 6.5% |
| Potawatomi | 0.0 /100 | #326 | Tragic 6.5% |
| French American Indians | 0.0 /100 | #327 | Tragic 6.6% |
| Pennsylvania Germans | 0.0 /100 | #328 | Tragic 6.6% |
Demographics Similar to Israelis by Disability Age 5 to 17
In terms of disability age 5 to 17, the demographic groups most similar to Israelis are Immigrants from Indonesia (5.0%, a difference of 0.12%), Bolivian (5.0%, a difference of 0.19%), Immigrants from Egypt (5.0%, a difference of 0.23%), Immigrants from Belarus (5.0%, a difference of 0.26%), and Immigrants from Philippines (5.0%, a difference of 0.30%).
| Demographics | Rating | Rank | Disability Age 5 to 17 |
| Taiwanese | 100.0 /100 | #27 | Exceptional 4.9% |
| Immigrants | Japan | 100.0 /100 | #28 | Exceptional 4.9% |
| Immigrants | Serbia | 100.0 /100 | #29 | Exceptional 4.9% |
| Immigrants | Malaysia | 100.0 /100 | #30 | Exceptional 5.0% |
| Immigrants | Pakistan | 100.0 /100 | #31 | Exceptional 5.0% |
| Soviet Union | 100.0 /100 | #32 | Exceptional 5.0% |
| Immigrants | Indonesia | 100.0 /100 | #33 | Exceptional 5.0% |
| Israelis | 100.0 /100 | #34 | Exceptional 5.0% |
| Bolivians | 100.0 /100 | #35 | Exceptional 5.0% |
| Immigrants | Egypt | 100.0 /100 | #36 | Exceptional 5.0% |
| Immigrants | Belarus | 100.0 /100 | #37 | Exceptional 5.0% |
| Immigrants | Philippines | 100.0 /100 | #38 | Exceptional 5.0% |
| Immigrants | Argentina | 100.0 /100 | #39 | Exceptional 5.0% |
| Okinawans | 100.0 /100 | #40 | Exceptional 5.0% |
| Immigrants | Australia | 100.0 /100 | #41 | Exceptional 5.0% |