Tohono O'odham vs Israeli Unemployment Among Ages 55 to 59 years
COMPARE
Tohono O'odham
Israeli
Unemployment Among Ages 55 to 59 years
Unemployment Among Ages 55 to 59 years Comparison
Tohono O'odham
Israelis
9.3%
UNEMPLOYMENT AMONG AGES 55 TO 59 YEARS
0.0/ 100
METRIC RATING
345th/ 347
METRIC RANK
5.2%
UNEMPLOYMENT AMONG AGES 55 TO 59 YEARS
0.0/ 100
METRIC RATING
275th/ 347
METRIC RANK
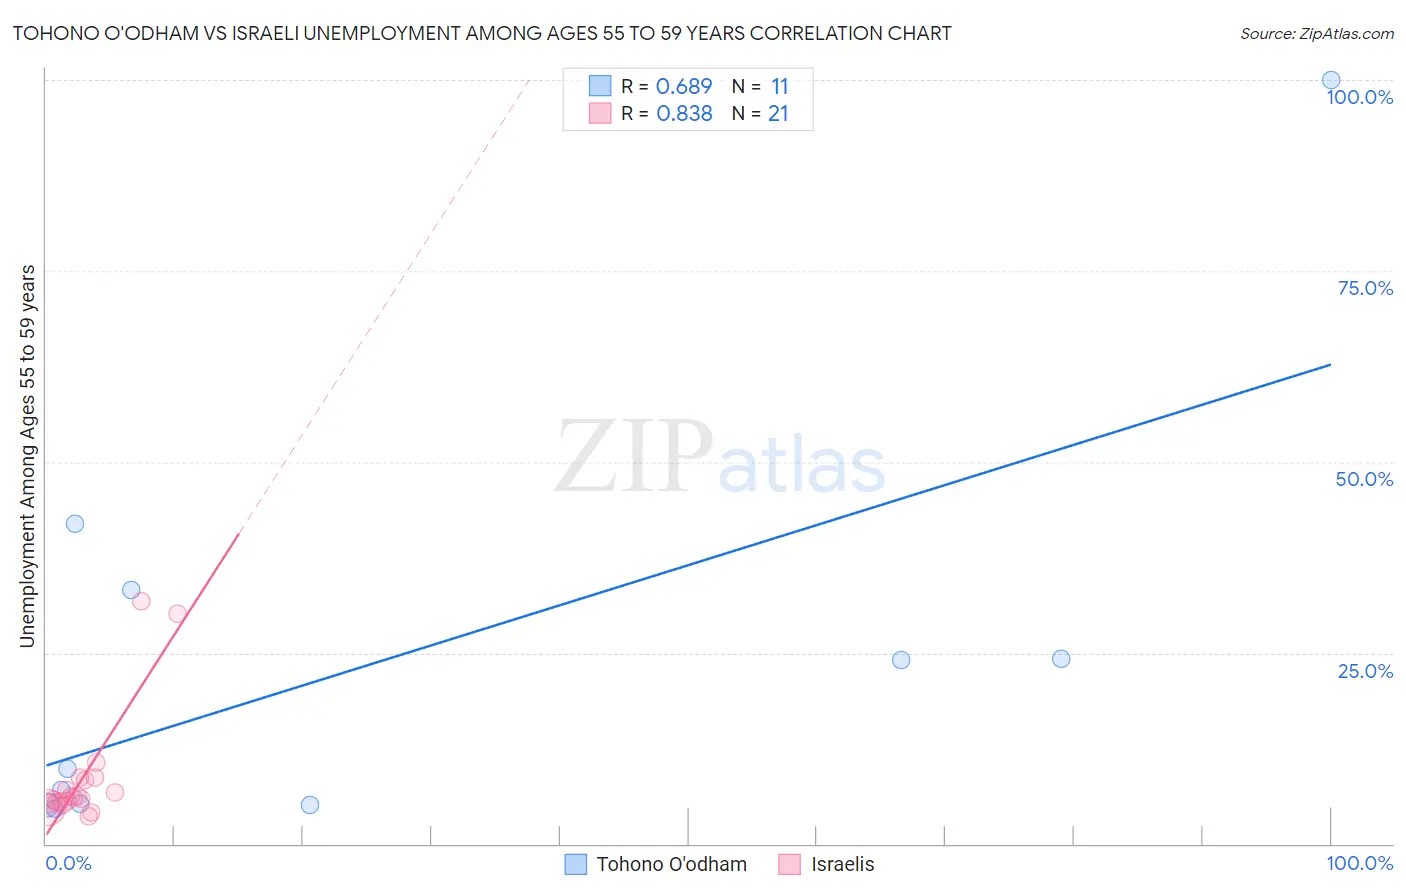
Tohono O'odham vs Israeli Unemployment Among Ages 55 to 59 years Correlation Chart
The statistical analysis conducted on geographies consisting of 57,631,598 people shows a significant positive correlation between the proportion of Tohono O'odham and unemployment rate among population between the ages 55 and 59 in the United States with a correlation coefficient (R) of 0.689 and weighted average of 9.3%. Similarly, the statistical analysis conducted on geographies consisting of 203,700,467 people shows a very strong positive correlation between the proportion of Israelis and unemployment rate among population between the ages 55 and 59 in the United States with a correlation coefficient (R) of 0.838 and weighted average of 5.2%, a difference of 78.4%.
Unemployment Among Ages 55 to 59 years Correlation Summary
| Measurement | Tohono O'odham | Israeli |
| Minimum | 4.6% | 3.5% |
| Maximum | 100.0% | 31.8% |
| Range | 95.4% | 28.3% |
| Mean | 23.7% | 8.6% |
| Median | 9.8% | 6.1% |
| Interquartile 25% (IQ1) | 5.1% | 5.3% |
| Interquartile 75% (IQ3) | 33.3% | 8.4% |
| Interquartile Range (IQR) | 28.2% | 3.1% |
| Standard Deviation (Sample) | 28.5% | 7.6% |
| Standard Deviation (Population) | 27.2% | 7.4% |
Similar Demographics by Unemployment Among Ages 55 to 59 years
Demographics Similar to Tohono O'odham by Unemployment Among Ages 55 to 59 years
In terms of unemployment among ages 55 to 59 years, the demographic groups most similar to Tohono O'odham are Inupiat (9.0%, a difference of 3.0%), Yakama (8.9%, a difference of 4.3%), Menominee (10.5%, a difference of 13.1%), Hopi (8.1%, a difference of 14.7%), and Shoshone (7.4%, a difference of 26.4%).
| Demographics | Rating | Rank | Unemployment Among Ages 55 to 59 years |
| Pima | 0.0 /100 | #333 | Tragic 6.6% |
| Pueblo | 0.0 /100 | #334 | Tragic 6.7% |
| Colville | 0.0 /100 | #335 | Tragic 6.7% |
| Navajo | 0.0 /100 | #336 | Tragic 6.7% |
| Paiute | 0.0 /100 | #337 | Tragic 6.8% |
| Immigrants | Yemen | 0.0 /100 | #338 | Tragic 6.9% |
| Puerto Ricans | 0.0 /100 | #339 | Tragic 7.0% |
| Alaskan Athabascans | 0.0 /100 | #340 | Tragic 7.1% |
| Shoshone | 0.0 /100 | #341 | Tragic 7.4% |
| Hopi | 0.0 /100 | #342 | Tragic 8.1% |
| Yakama | 0.0 /100 | #343 | Tragic 8.9% |
| Inupiat | 0.0 /100 | #344 | Tragic 9.0% |
| Tohono O'odham | 0.0 /100 | #345 | Tragic 9.3% |
| Menominee | 0.0 /100 | #346 | Tragic 10.5% |
| Yup'ik | 0.0 /100 | #347 | Tragic 13.9% |
Demographics Similar to Israelis by Unemployment Among Ages 55 to 59 years
In terms of unemployment among ages 55 to 59 years, the demographic groups most similar to Israelis are West Indian (5.2%, a difference of 0.010%), Mexican American Indian (5.2%, a difference of 0.10%), Immigrants from Latin America (5.2%, a difference of 0.13%), Ottawa (5.2%, a difference of 0.22%), and Immigrants from Barbados (5.2%, a difference of 0.31%).
| Demographics | Rating | Rank | Unemployment Among Ages 55 to 59 years |
| Mexicans | 0.1 /100 | #268 | Tragic 5.2% |
| Tsimshian | 0.1 /100 | #269 | Tragic 5.2% |
| Ute | 0.1 /100 | #270 | Tragic 5.2% |
| Cree | 0.1 /100 | #271 | Tragic 5.2% |
| Immigrants | Jamaica | 0.0 /100 | #272 | Tragic 5.2% |
| Ottawa | 0.0 /100 | #273 | Tragic 5.2% |
| Mexican American Indians | 0.0 /100 | #274 | Tragic 5.2% |
| Israelis | 0.0 /100 | #275 | Tragic 5.2% |
| West Indians | 0.0 /100 | #276 | Tragic 5.2% |
| Immigrants | Latin America | 0.0 /100 | #277 | Tragic 5.2% |
| Immigrants | Barbados | 0.0 /100 | #278 | Tragic 5.2% |
| Alsatians | 0.0 /100 | #279 | Tragic 5.2% |
| Immigrants | Uzbekistan | 0.0 /100 | #280 | Tragic 5.3% |
| Guatemalans | 0.0 /100 | #281 | Tragic 5.3% |
| Immigrants | Trinidad and Tobago | 0.0 /100 | #282 | Tragic 5.3% |