Assyrian/Chaldean/Syriac vs Welsh Disability Age 35 to 64
COMPARE
Assyrian/Chaldean/Syriac
Welsh
Disability Age 35 to 64
Disability Age 35 to 64 Comparison
Assyrians/Chaldeans/Syriacs
Welsh
10.5%
DISABILITY AGE 35 TO 64
96.8/ 100
METRIC RATING
112th/ 347
METRIC RANK
12.4%
DISABILITY AGE 35 TO 64
0.6/ 100
METRIC RATING
258th/ 347
METRIC RANK
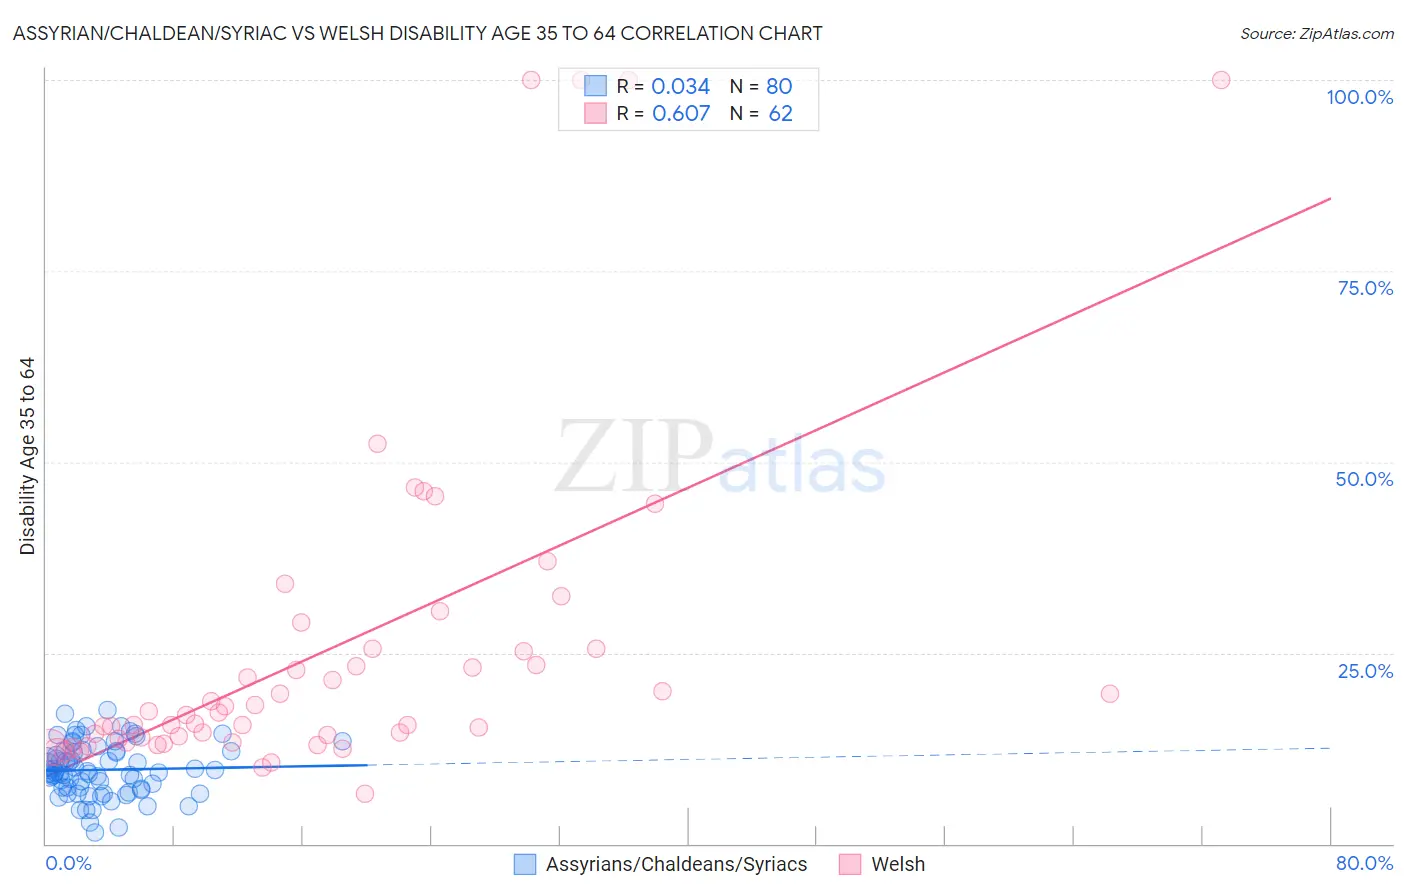
Assyrian/Chaldean/Syriac vs Welsh Disability Age 35 to 64 Correlation Chart
The statistical analysis conducted on geographies consisting of 110,296,626 people shows no correlation between the proportion of Assyrians/Chaldeans/Syriacs and percentage of population with a disability between the ages 34 and 64 in the United States with a correlation coefficient (R) of 0.034 and weighted average of 10.5%. Similarly, the statistical analysis conducted on geographies consisting of 527,956,367 people shows a significant positive correlation between the proportion of Welsh and percentage of population with a disability between the ages 34 and 64 in the United States with a correlation coefficient (R) of 0.607 and weighted average of 12.4%, a difference of 18.2%.
Disability Age 35 to 64 Correlation Summary
| Measurement | Assyrian/Chaldean/Syriac | Welsh |
| Minimum | 1.5% | 6.5% |
| Maximum | 17.5% | 100.0% |
| Range | 16.0% | 93.5% |
| Mean | 9.7% | 25.5% |
| Median | 9.4% | 17.0% |
| Interquartile 25% (IQ1) | 7.2% | 13.8% |
| Interquartile 75% (IQ3) | 12.1% | 25.5% |
| Interquartile Range (IQR) | 4.9% | 11.7% |
| Standard Deviation (Sample) | 3.4% | 22.1% |
| Standard Deviation (Population) | 3.4% | 21.9% |
Similar Demographics by Disability Age 35 to 64
Demographics Similar to Assyrians/Chaldeans/Syriacs by Disability Age 35 to 64
In terms of disability age 35 to 64, the demographic groups most similar to Assyrians/Chaldeans/Syriacs are Brazilian (10.5%, a difference of 0.030%), Tongan (10.5%, a difference of 0.12%), Immigrants from Morocco (10.5%, a difference of 0.17%), Korean (10.5%, a difference of 0.24%), and Immigrants from Ethiopia (10.5%, a difference of 0.30%).
| Demographics | Rating | Rank | Disability Age 35 to 64 |
| Macedonians | 97.8 /100 | #105 | Exceptional 10.4% |
| Immigrants | Hungary | 97.6 /100 | #106 | Exceptional 10.4% |
| Zimbabweans | 97.4 /100 | #107 | Exceptional 10.4% |
| Ethiopians | 97.4 /100 | #108 | Exceptional 10.5% |
| Immigrants | Ethiopia | 97.2 /100 | #109 | Exceptional 10.5% |
| Koreans | 97.1 /100 | #110 | Exceptional 10.5% |
| Brazilians | 96.9 /100 | #111 | Exceptional 10.5% |
| Assyrians/Chaldeans/Syriacs | 96.8 /100 | #112 | Exceptional 10.5% |
| Tongans | 96.6 /100 | #113 | Exceptional 10.5% |
| Immigrants | Morocco | 96.6 /100 | #114 | Exceptional 10.5% |
| Immigrants | Netherlands | 96.3 /100 | #115 | Exceptional 10.5% |
| Immigrants | Nepal | 95.9 /100 | #116 | Exceptional 10.6% |
| Immigrants | South Eastern Asia | 95.7 /100 | #117 | Exceptional 10.6% |
| Immigrants | Moldova | 95.5 /100 | #118 | Exceptional 10.6% |
| Luxembourgers | 95.5 /100 | #119 | Exceptional 10.6% |
Demographics Similar to Welsh by Disability Age 35 to 64
In terms of disability age 35 to 64, the demographic groups most similar to Welsh are Mexican (12.4%, a difference of 0.080%), English (12.4%, a difference of 0.12%), Scottish (12.4%, a difference of 0.34%), German Russian (12.5%, a difference of 0.37%), and Japanese (12.3%, a difference of 0.51%).
| Demographics | Rating | Rank | Disability Age 35 to 64 |
| Germans | 1.1 /100 | #251 | Tragic 12.3% |
| Irish | 1.0 /100 | #252 | Tragic 12.3% |
| Dutch | 1.0 /100 | #253 | Tragic 12.3% |
| Hawaiians | 0.9 /100 | #254 | Tragic 12.3% |
| Japanese | 0.8 /100 | #255 | Tragic 12.3% |
| Scottish | 0.8 /100 | #256 | Tragic 12.4% |
| Mexicans | 0.7 /100 | #257 | Tragic 12.4% |
| Welsh | 0.6 /100 | #258 | Tragic 12.4% |
| English | 0.6 /100 | #259 | Tragic 12.4% |
| German Russians | 0.5 /100 | #260 | Tragic 12.5% |
| Malaysians | 0.5 /100 | #261 | Tragic 12.5% |
| Senegalese | 0.5 /100 | #262 | Tragic 12.5% |
| Immigrants | Zaire | 0.4 /100 | #263 | Tragic 12.5% |
| Immigrants | Portugal | 0.4 /100 | #264 | Tragic 12.5% |
| Marshallese | 0.4 /100 | #265 | Tragic 12.5% |