Immigrants from Burma/Myanmar vs Peruvian Disability Age 35 to 64
COMPARE
Immigrants from Burma/Myanmar
Peruvian
Disability Age 35 to 64
Disability Age 35 to 64 Comparison
Immigrants from Burma/Myanmar
Peruvians
12.3%
DISABILITY AGE 35 TO 64
1.2/ 100
METRIC RATING
250th/ 347
METRIC RANK
9.9%
DISABILITY AGE 35 TO 64
99.8/ 100
METRIC RATING
55th/ 347
METRIC RANK
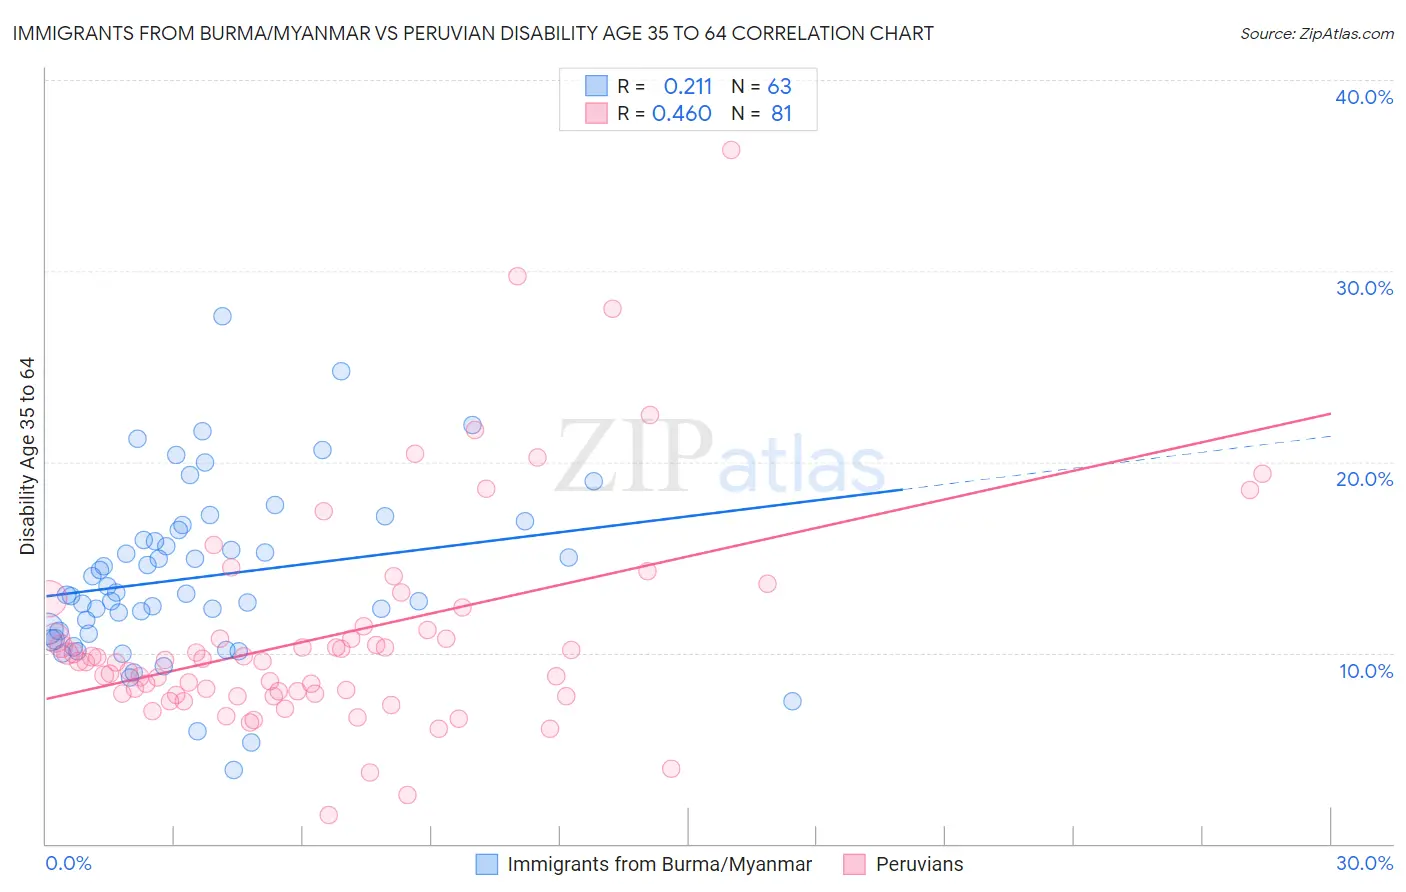
Immigrants from Burma/Myanmar vs Peruvian Disability Age 35 to 64 Correlation Chart
The statistical analysis conducted on geographies consisting of 172,272,577 people shows a weak positive correlation between the proportion of Immigrants from Burma/Myanmar and percentage of population with a disability between the ages 34 and 64 in the United States with a correlation coefficient (R) of 0.211 and weighted average of 12.3%. Similarly, the statistical analysis conducted on geographies consisting of 362,944,439 people shows a moderate positive correlation between the proportion of Peruvians and percentage of population with a disability between the ages 34 and 64 in the United States with a correlation coefficient (R) of 0.460 and weighted average of 9.9%, a difference of 24.6%.
Disability Age 35 to 64 Correlation Summary
| Measurement | Immigrants from Burma/Myanmar | Peruvian |
| Minimum | 3.9% | 1.5% |
| Maximum | 27.6% | 36.3% |
| Range | 23.7% | 34.8% |
| Mean | 14.0% | 10.9% |
| Median | 13.1% | 9.6% |
| Interquartile 25% (IQ1) | 11.0% | 7.8% |
| Interquartile 75% (IQ3) | 16.5% | 11.3% |
| Interquartile Range (IQR) | 5.5% | 3.5% |
| Standard Deviation (Sample) | 4.5% | 5.8% |
| Standard Deviation (Population) | 4.5% | 5.7% |
Similar Demographics by Disability Age 35 to 64
Demographics Similar to Immigrants from Burma/Myanmar by Disability Age 35 to 64
In terms of disability age 35 to 64, the demographic groups most similar to Immigrants from Burma/Myanmar are German (12.3%, a difference of 0.080%), Hispanic or Latino (12.3%, a difference of 0.13%), Spaniard (12.3%, a difference of 0.16%), Immigrants from Senegal (12.2%, a difference of 0.26%), and Guamanian/Chamorro (12.2%, a difference of 0.29%).
| Demographics | Rating | Rank | Disability Age 35 to 64 |
| Slovaks | 2.7 /100 | #243 | Tragic 12.1% |
| Finns | 2.3 /100 | #244 | Tragic 12.1% |
| Immigrants | Mexico | 2.2 /100 | #245 | Tragic 12.1% |
| Guamanians/Chamorros | 1.4 /100 | #246 | Tragic 12.2% |
| Immigrants | Senegal | 1.3 /100 | #247 | Tragic 12.2% |
| Spaniards | 1.3 /100 | #248 | Tragic 12.3% |
| Hispanics or Latinos | 1.3 /100 | #249 | Tragic 12.3% |
| Immigrants | Burma/Myanmar | 1.2 /100 | #250 | Tragic 12.3% |
| Germans | 1.1 /100 | #251 | Tragic 12.3% |
| Irish | 1.0 /100 | #252 | Tragic 12.3% |
| Dutch | 1.0 /100 | #253 | Tragic 12.3% |
| Hawaiians | 0.9 /100 | #254 | Tragic 12.3% |
| Japanese | 0.8 /100 | #255 | Tragic 12.3% |
| Scottish | 0.8 /100 | #256 | Tragic 12.4% |
| Mexicans | 0.7 /100 | #257 | Tragic 12.4% |
Demographics Similar to Peruvians by Disability Age 35 to 64
In terms of disability age 35 to 64, the demographic groups most similar to Peruvians are Immigrants from Russia (9.8%, a difference of 0.060%), Taiwanese (9.8%, a difference of 0.10%), Immigrants from Bulgaria (9.8%, a difference of 0.16%), Bhutanese (9.8%, a difference of 0.17%), and South American (9.9%, a difference of 0.22%).
| Demographics | Rating | Rank | Disability Age 35 to 64 |
| Immigrants | Serbia | 99.8 /100 | #48 | Exceptional 9.8% |
| Immigrants | Greece | 99.8 /100 | #49 | Exceptional 9.8% |
| Paraguayans | 99.8 /100 | #50 | Exceptional 9.8% |
| Bhutanese | 99.8 /100 | #51 | Exceptional 9.8% |
| Immigrants | Bulgaria | 99.8 /100 | #52 | Exceptional 9.8% |
| Taiwanese | 99.8 /100 | #53 | Exceptional 9.8% |
| Immigrants | Russia | 99.8 /100 | #54 | Exceptional 9.8% |
| Peruvians | 99.8 /100 | #55 | Exceptional 9.9% |
| South Americans | 99.8 /100 | #56 | Exceptional 9.9% |
| Colombians | 99.8 /100 | #57 | Exceptional 9.9% |
| Armenians | 99.8 /100 | #58 | Exceptional 9.9% |
| Immigrants | Sweden | 99.7 /100 | #59 | Exceptional 9.9% |
| Immigrants | South America | 99.7 /100 | #60 | Exceptional 9.9% |
| Immigrants | Spain | 99.7 /100 | #61 | Exceptional 10.0% |
| Eastern Europeans | 99.7 /100 | #62 | Exceptional 10.0% |