Immigrants from Cambodia vs Immigrants from Senegal Female Disability
COMPARE
Immigrants from Cambodia
Immigrants from Senegal
Female Disability
Female Disability Comparison
Immigrants from Cambodia
Immigrants from Senegal
12.5%
FEMALE DISABILITY
7.8/ 100
METRIC RATING
228th/ 347
METRIC RANK
12.6%
FEMALE DISABILITY
2.5/ 100
METRIC RATING
243rd/ 347
METRIC RANK
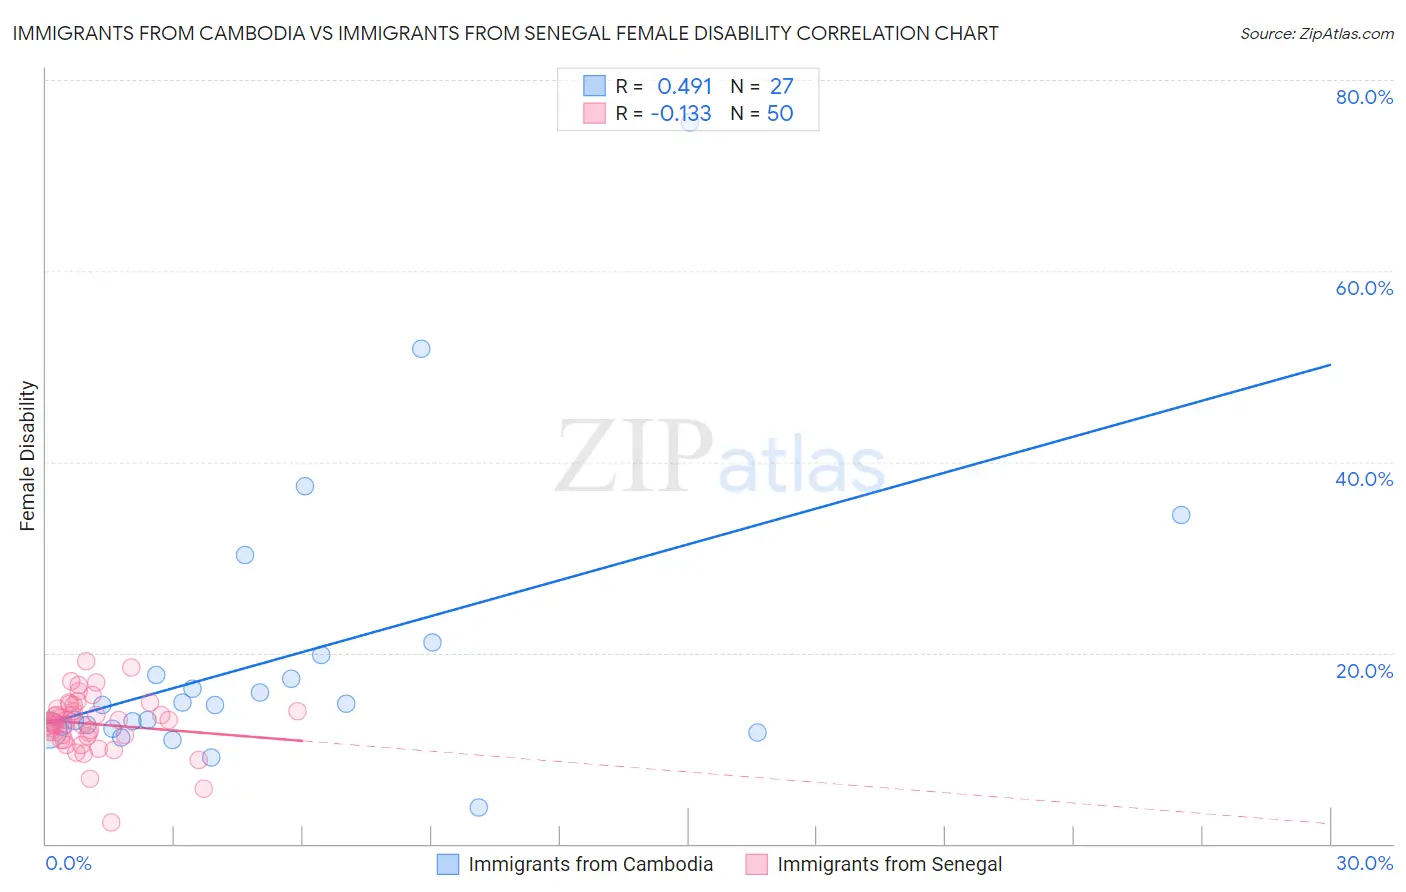
Immigrants from Cambodia vs Immigrants from Senegal Female Disability Correlation Chart
The statistical analysis conducted on geographies consisting of 205,152,256 people shows a moderate positive correlation between the proportion of Immigrants from Cambodia and percentage of females with a disability in the United States with a correlation coefficient (R) of 0.491 and weighted average of 12.5%. Similarly, the statistical analysis conducted on geographies consisting of 90,125,924 people shows a poor negative correlation between the proportion of Immigrants from Senegal and percentage of females with a disability in the United States with a correlation coefficient (R) of -0.133 and weighted average of 12.6%, a difference of 1.1%.
Female Disability Correlation Summary
| Measurement | Immigrants from Cambodia | Immigrants from Senegal |
| Minimum | 3.8% | 2.3% |
| Maximum | 75.5% | 19.1% |
| Range | 71.7% | 16.9% |
| Mean | 19.6% | 12.6% |
| Median | 14.5% | 12.7% |
| Interquartile 25% (IQ1) | 12.0% | 11.2% |
| Interquartile 75% (IQ3) | 19.8% | 14.2% |
| Interquartile Range (IQR) | 7.8% | 2.9% |
| Standard Deviation (Sample) | 15.0% | 3.0% |
| Standard Deviation (Population) | 14.8% | 3.0% |
Demographics Similar to Immigrants from Cambodia and Immigrants from Senegal by Female Disability
In terms of female disability, the demographic groups most similar to Immigrants from Cambodia are Hispanic or Latino (12.5%, a difference of 0.030%), Assyrian/Chaldean/Syriac (12.5%, a difference of 0.030%), Hungarian (12.5%, a difference of 0.070%), Polish (12.5%, a difference of 0.080%), and Immigrants from Belize (12.5%, a difference of 0.11%). Similarly, the demographic groups most similar to Immigrants from Senegal are Canadian (12.6%, a difference of 0.010%), Alsatian (12.6%, a difference of 0.010%), Japanese (12.6%, a difference of 0.060%), Immigrants from Jamaica (12.6%, a difference of 0.15%), and German Russian (12.6%, a difference of 0.23%).
| Demographics | Rating | Rank | Female Disability |
| Poles | 8.4 /100 | #225 | Tragic 12.5% |
| Hispanics or Latinos | 8.0 /100 | #226 | Tragic 12.5% |
| Assyrians/Chaldeans/Syriacs | 8.0 /100 | #227 | Tragic 12.5% |
| Immigrants | Cambodia | 7.8 /100 | #228 | Tragic 12.5% |
| Hungarians | 7.2 /100 | #229 | Tragic 12.5% |
| Immigrants | Belize | 7.0 /100 | #230 | Tragic 12.5% |
| Belgians | 6.5 /100 | #231 | Tragic 12.5% |
| Immigrants | Somalia | 5.9 /100 | #232 | Tragic 12.5% |
| Immigrants | Iraq | 5.3 /100 | #233 | Tragic 12.5% |
| Scandinavians | 5.3 /100 | #234 | Tragic 12.5% |
| Malaysians | 5.0 /100 | #235 | Tragic 12.5% |
| Immigrants | West Indies | 4.4 /100 | #236 | Tragic 12.6% |
| Slavs | 3.8 /100 | #237 | Tragic 12.6% |
| Yugoslavians | 3.7 /100 | #238 | Tragic 12.6% |
| Barbadians | 3.6 /100 | #239 | Tragic 12.6% |
| German Russians | 3.2 /100 | #240 | Tragic 12.6% |
| Japanese | 2.7 /100 | #241 | Tragic 12.6% |
| Canadians | 2.6 /100 | #242 | Tragic 12.6% |
| Immigrants | Senegal | 2.5 /100 | #243 | Tragic 12.6% |
| Alsatians | 2.5 /100 | #244 | Tragic 12.6% |
| Immigrants | Jamaica | 2.2 /100 | #245 | Tragic 12.6% |