Tlingit-Haida vs Immigrants from Senegal In Labor Force | Age 20-24
COMPARE
Tlingit-Haida
Immigrants from Senegal
In Labor Force | Age 20-24
In Labor Force | Age 20-24 Comparison
Tlingit-Haida
Immigrants from Senegal
77.9%
IN LABOR FORCE | AGE 20-24
100.0/ 100
METRIC RATING
25th/ 347
METRIC RANK
74.0%
IN LABOR FORCE | AGE 20-24
2.1/ 100
METRIC RATING
241st/ 347
METRIC RANK
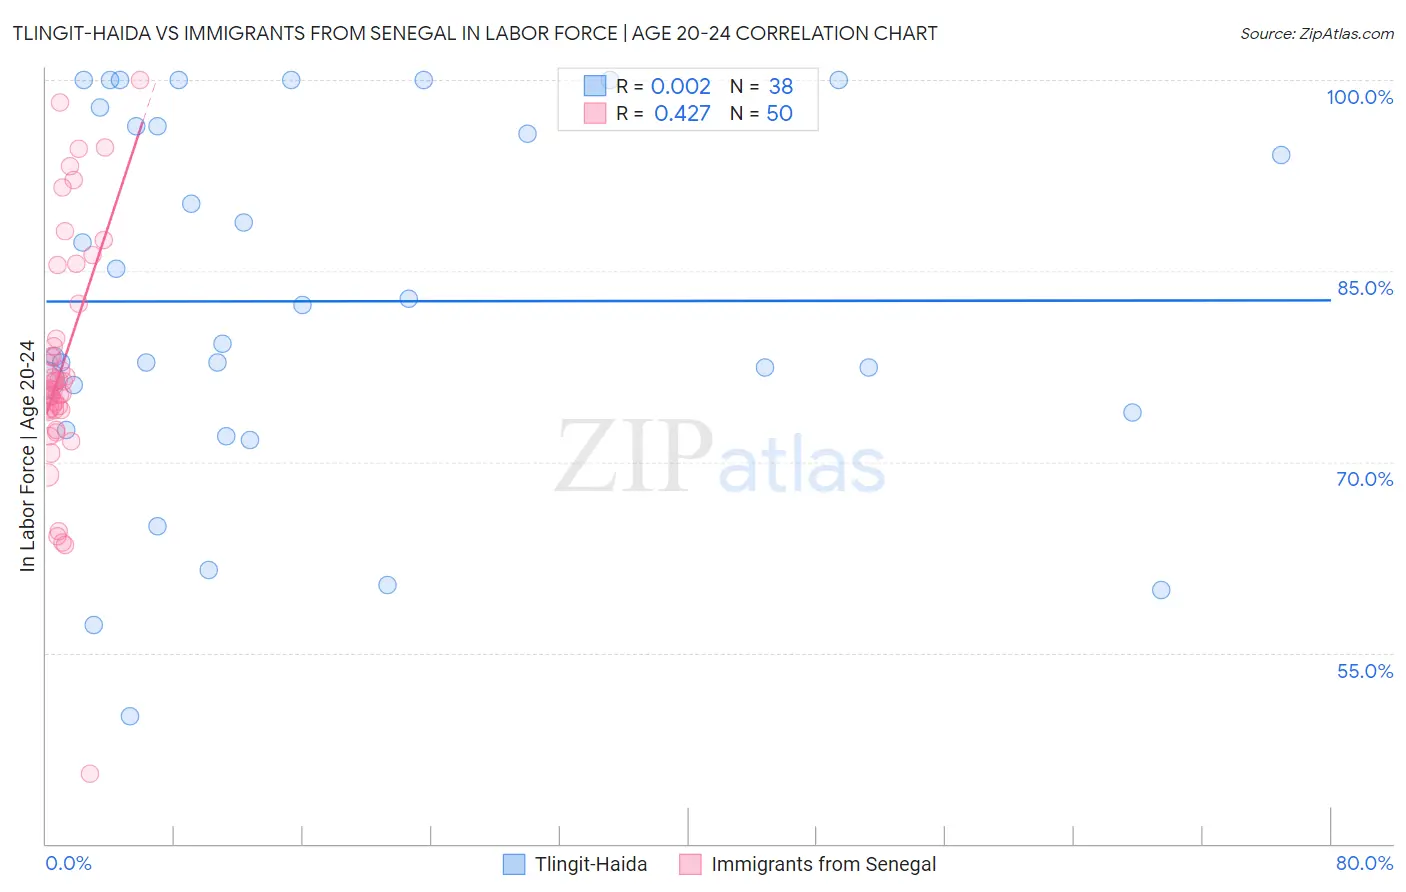
Tlingit-Haida vs Immigrants from Senegal In Labor Force | Age 20-24 Correlation Chart
The statistical analysis conducted on geographies consisting of 60,858,700 people shows no correlation between the proportion of Tlingit-Haida and labor force participation rate among population between the ages 20 and 24 in the United States with a correlation coefficient (R) of 0.002 and weighted average of 77.9%. Similarly, the statistical analysis conducted on geographies consisting of 90,118,430 people shows a moderate positive correlation between the proportion of Immigrants from Senegal and labor force participation rate among population between the ages 20 and 24 in the United States with a correlation coefficient (R) of 0.427 and weighted average of 74.0%, a difference of 5.3%.
In Labor Force | Age 20-24 Correlation Summary
| Measurement | Tlingit-Haida | Immigrants from Senegal |
| Minimum | 50.0% | 45.5% |
| Maximum | 100.0% | 100.0% |
| Range | 50.0% | 54.5% |
| Mean | 82.6% | 77.7% |
| Median | 80.8% | 76.0% |
| Interquartile 25% (IQ1) | 73.9% | 74.1% |
| Interquartile 75% (IQ3) | 96.4% | 82.4% |
| Interquartile Range (IQR) | 22.5% | 8.3% |
| Standard Deviation (Sample) | 14.3% | 9.8% |
| Standard Deviation (Population) | 14.1% | 9.7% |
Similar Demographics by In Labor Force | Age 20-24
Demographics Similar to Tlingit-Haida by In Labor Force | Age 20-24
In terms of in labor force | age 20-24, the demographic groups most similar to Tlingit-Haida are Tongan (77.9%, a difference of 0.020%), Yugoslavian (78.0%, a difference of 0.040%), Liberian (78.0%, a difference of 0.040%), Pennsylvania German (78.0%, a difference of 0.050%), and Puget Sound Salish (78.0%, a difference of 0.11%).
| Demographics | Rating | Rank | In Labor Force | Age 20-24 |
| Immigrants | Bosnia and Herzegovina | 100.0 /100 | #18 | Exceptional 78.1% |
| Bangladeshis | 100.0 /100 | #19 | Exceptional 78.1% |
| French Canadians | 100.0 /100 | #20 | Exceptional 78.1% |
| Puget Sound Salish | 100.0 /100 | #21 | Exceptional 78.0% |
| Pennsylvania Germans | 100.0 /100 | #22 | Exceptional 78.0% |
| Yugoslavians | 100.0 /100 | #23 | Exceptional 78.0% |
| Liberians | 100.0 /100 | #24 | Exceptional 78.0% |
| Tlingit-Haida | 100.0 /100 | #25 | Exceptional 77.9% |
| Tongans | 100.0 /100 | #26 | Exceptional 77.9% |
| Immigrants | Micronesia | 100.0 /100 | #27 | Exceptional 77.8% |
| Belgians | 100.0 /100 | #28 | Exceptional 77.8% |
| Slovaks | 100.0 /100 | #29 | Exceptional 77.7% |
| Swiss | 100.0 /100 | #30 | Exceptional 77.7% |
| Poles | 100.0 /100 | #31 | Exceptional 77.6% |
| English | 100.0 /100 | #32 | Exceptional 77.6% |
Demographics Similar to Immigrants from Senegal by In Labor Force | Age 20-24
In terms of in labor force | age 20-24, the demographic groups most similar to Immigrants from Senegal are Thai (74.0%, a difference of 0.010%), Immigrants from Sri Lanka (74.0%, a difference of 0.030%), Immigrants from Syria (74.0%, a difference of 0.040%), Immigrants from South Central Asia (74.0%, a difference of 0.040%), and Turkish (73.9%, a difference of 0.070%).
| Demographics | Rating | Rank | In Labor Force | Age 20-24 |
| Immigrants | Immigrants | 3.6 /100 | #234 | Tragic 74.1% |
| Laotians | 3.5 /100 | #235 | Tragic 74.1% |
| Immigrants | France | 3.3 /100 | #236 | Tragic 74.1% |
| Bermudans | 3.2 /100 | #237 | Tragic 74.1% |
| Immigrants | Japan | 3.0 /100 | #238 | Tragic 74.1% |
| Immigrants | Latin America | 2.7 /100 | #239 | Tragic 74.1% |
| Immigrants | Sri Lanka | 2.3 /100 | #240 | Tragic 74.0% |
| Immigrants | Senegal | 2.1 /100 | #241 | Tragic 74.0% |
| Thais | 2.1 /100 | #242 | Tragic 74.0% |
| Immigrants | Syria | 1.9 /100 | #243 | Tragic 74.0% |
| Immigrants | South Central Asia | 1.9 /100 | #244 | Tragic 74.0% |
| Turks | 1.8 /100 | #245 | Tragic 73.9% |
| Immigrants | Panama | 1.6 /100 | #246 | Tragic 73.9% |
| Colville | 1.5 /100 | #247 | Tragic 73.9% |
| Immigrants | Saudi Arabia | 1.5 /100 | #248 | Tragic 73.9% |