Tlingit-Haida vs Chippewa Hearing Disability
COMPARE
Tlingit-Haida
Chippewa
Hearing Disability
Hearing Disability Comparison
Tlingit-Haida
Chippewa
4.8%
HEARING DISABILITY
0.0/ 100
METRIC RATING
344th/ 347
METRIC RANK
4.0%
HEARING DISABILITY
0.0/ 100
METRIC RATING
319th/ 347
METRIC RANK
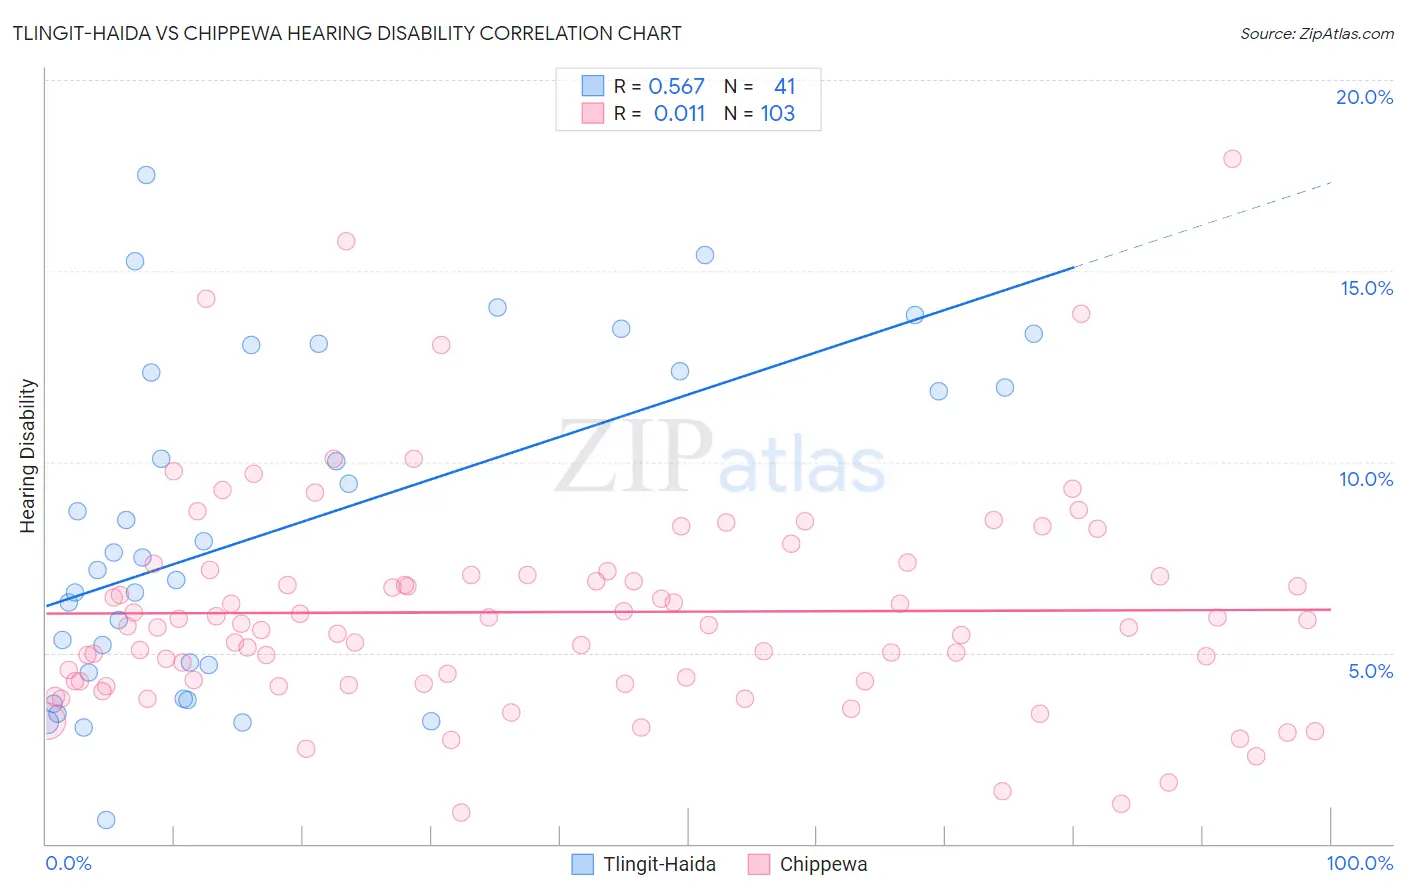
Tlingit-Haida vs Chippewa Hearing Disability Correlation Chart
The statistical analysis conducted on geographies consisting of 60,852,790 people shows a substantial positive correlation between the proportion of Tlingit-Haida and percentage of population with hearing disability in the United States with a correlation coefficient (R) of 0.567 and weighted average of 4.8%. Similarly, the statistical analysis conducted on geographies consisting of 215,037,759 people shows no correlation between the proportion of Chippewa and percentage of population with hearing disability in the United States with a correlation coefficient (R) of 0.011 and weighted average of 4.0%, a difference of 21.3%.
Hearing Disability Correlation Summary
| Measurement | Tlingit-Haida | Chippewa |
| Minimum | 0.61% | 0.81% |
| Maximum | 17.5% | 17.9% |
| Range | 16.9% | 17.1% |
| Mean | 8.3% | 6.1% |
| Median | 7.5% | 5.7% |
| Interquartile 25% (IQ1) | 4.6% | 4.2% |
| Interquartile 75% (IQ3) | 12.4% | 7.0% |
| Interquartile Range (IQR) | 7.8% | 2.8% |
| Standard Deviation (Sample) | 4.3% | 2.9% |
| Standard Deviation (Population) | 4.3% | 2.9% |
Similar Demographics by Hearing Disability
Demographics Similar to Tlingit-Haida by Hearing Disability
In terms of hearing disability, the demographic groups most similar to Tlingit-Haida are Inupiat (4.7%, a difference of 2.7%), Tsimshian (4.7%, a difference of 2.9%), Navajo (4.6%, a difference of 4.5%), Pueblo (4.6%, a difference of 4.9%), and Choctaw (4.5%, a difference of 6.4%).
| Demographics | Rating | Rank | Hearing Disability |
| Dutch West Indians | 0.0 /100 | #333 | Tragic 4.3% |
| Aleuts | 0.0 /100 | #334 | Tragic 4.3% |
| Kiowa | 0.0 /100 | #335 | Tragic 4.3% |
| Creek | 0.0 /100 | #336 | Tragic 4.4% |
| Chickasaw | 0.0 /100 | #337 | Tragic 4.5% |
| Alaska Natives | 0.0 /100 | #338 | Tragic 4.5% |
| Choctaw | 0.0 /100 | #339 | Tragic 4.5% |
| Pueblo | 0.0 /100 | #340 | Tragic 4.6% |
| Navajo | 0.0 /100 | #341 | Tragic 4.6% |
| Tsimshian | 0.0 /100 | #342 | Tragic 4.7% |
| Inupiat | 0.0 /100 | #343 | Tragic 4.7% |
| Tlingit-Haida | 0.0 /100 | #344 | Tragic 4.8% |
| Alaskan Athabascans | 0.0 /100 | #345 | Tragic 5.3% |
| Colville | 0.0 /100 | #346 | Tragic 5.3% |
| Yup'ik | 0.0 /100 | #347 | Tragic 5.8% |
Demographics Similar to Chippewa by Hearing Disability
In terms of hearing disability, the demographic groups most similar to Chippewa are Cheyenne (4.0%, a difference of 0.65%), Shoshone (4.0%, a difference of 0.81%), Comanche (4.0%, a difference of 0.82%), Spanish American (4.0%, a difference of 0.95%), and Puget Sound Salish (3.9%, a difference of 1.1%).
| Demographics | Rating | Rank | Hearing Disability |
| Cajuns | 0.0 /100 | #312 | Tragic 3.9% |
| Hopi | 0.0 /100 | #313 | Tragic 3.9% |
| Yakama | 0.0 /100 | #314 | Tragic 3.9% |
| Puget Sound Salish | 0.0 /100 | #315 | Tragic 3.9% |
| Spanish Americans | 0.0 /100 | #316 | Tragic 4.0% |
| Comanche | 0.0 /100 | #317 | Tragic 4.0% |
| Cheyenne | 0.0 /100 | #318 | Tragic 4.0% |
| Chippewa | 0.0 /100 | #319 | Tragic 4.0% |
| Shoshone | 0.0 /100 | #320 | Tragic 4.0% |
| Paiute | 0.0 /100 | #321 | Tragic 4.1% |
| Seminole | 0.0 /100 | #322 | Tragic 4.1% |
| Apache | 0.0 /100 | #323 | Tragic 4.1% |
| Osage | 0.0 /100 | #324 | Tragic 4.1% |
| Lumbee | 0.0 /100 | #325 | Tragic 4.1% |
| Potawatomi | 0.0 /100 | #326 | Tragic 4.1% |