Tlingit-Haida vs Immigrants from Eastern Europe Female Poverty Among 18-24 Year Olds
COMPARE
Tlingit-Haida
Immigrants from Eastern Europe
Female Poverty Among 18-24 Year Olds
Female Poverty Among 18-24 Year Olds Comparison
Tlingit-Haida
Immigrants from Eastern Europe
22.0%
FEMALE POVERTY AMONG 18-24 YEAR OLDS
0.0/ 100
METRIC RATING
284th/ 347
METRIC RANK
18.2%
FEMALE POVERTY AMONG 18-24 YEAR OLDS
99.9/ 100
METRIC RATING
51st/ 347
METRIC RANK
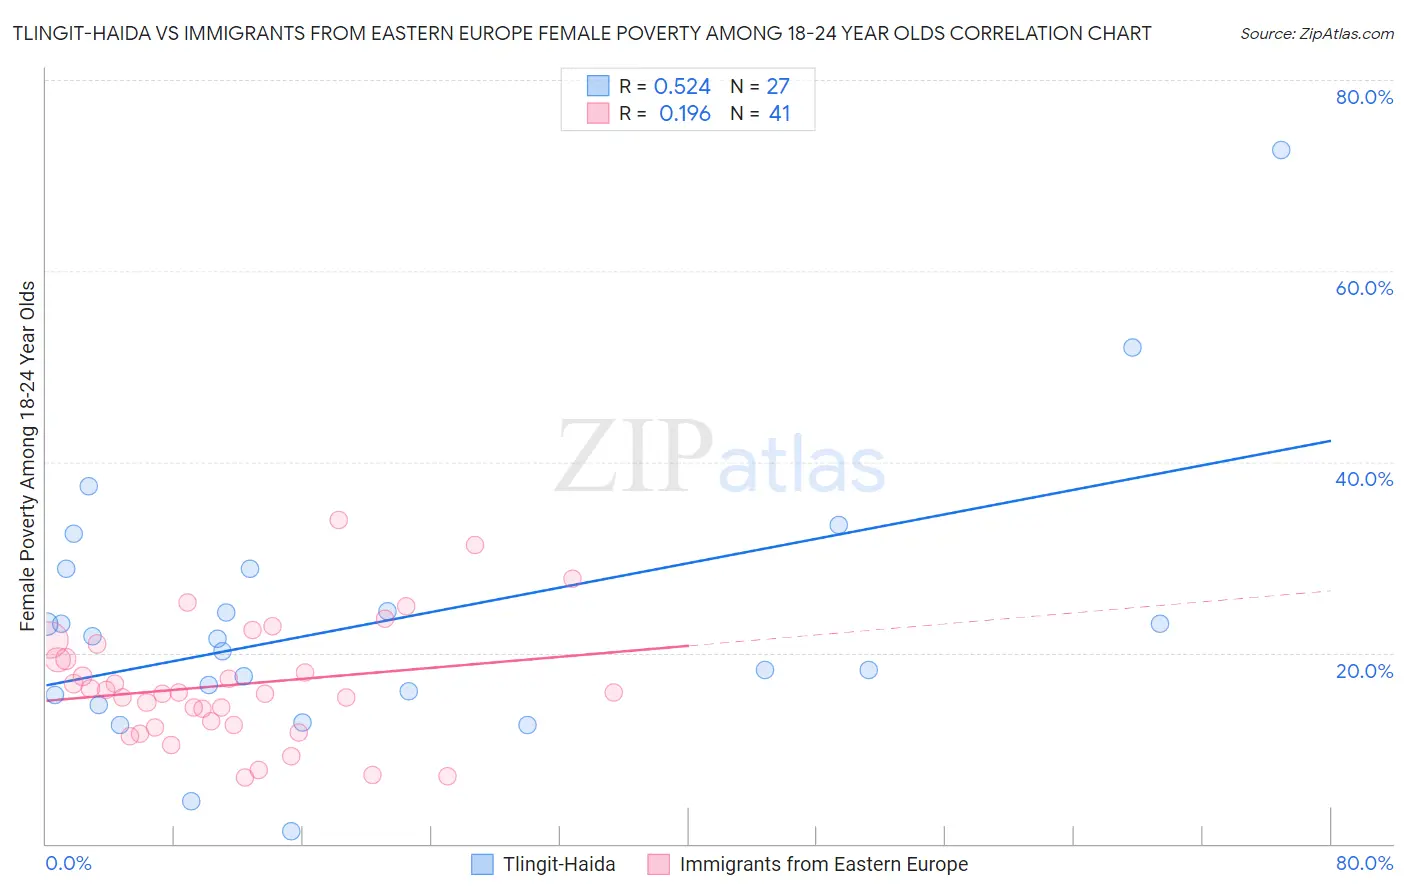
Tlingit-Haida vs Immigrants from Eastern Europe Female Poverty Among 18-24 Year Olds Correlation Chart
The statistical analysis conducted on geographies consisting of 60,396,606 people shows a substantial positive correlation between the proportion of Tlingit-Haida and poverty level among females between the ages 18 and 24 in the United States with a correlation coefficient (R) of 0.524 and weighted average of 22.0%. Similarly, the statistical analysis conducted on geographies consisting of 457,147,283 people shows a poor positive correlation between the proportion of Immigrants from Eastern Europe and poverty level among females between the ages 18 and 24 in the United States with a correlation coefficient (R) of 0.196 and weighted average of 18.2%, a difference of 20.6%.
Female Poverty Among 18-24 Year Olds Correlation Summary
| Measurement | Tlingit-Haida | Immigrants from Eastern Europe |
| Minimum | 1.3% | 6.9% |
| Maximum | 72.7% | 33.9% |
| Range | 71.4% | 27.0% |
| Mean | 23.2% | 16.6% |
| Median | 21.4% | 15.8% |
| Interquartile 25% (IQ1) | 15.6% | 12.3% |
| Interquartile 75% (IQ3) | 28.8% | 20.2% |
| Interquartile Range (IQR) | 13.2% | 7.9% |
| Standard Deviation (Sample) | 14.2% | 6.3% |
| Standard Deviation (Population) | 13.9% | 6.2% |
Similar Demographics by Female Poverty Among 18-24 Year Olds
Demographics Similar to Tlingit-Haida by Female Poverty Among 18-24 Year Olds
In terms of female poverty among 18-24 year olds, the demographic groups most similar to Tlingit-Haida are Subsaharan African (22.0%, a difference of 0.010%), Ottawa (22.0%, a difference of 0.12%), Bermudan (21.9%, a difference of 0.31%), Ugandan (22.1%, a difference of 0.31%), and Immigrants from Middle Africa (22.1%, a difference of 0.32%).
| Demographics | Rating | Rank | Female Poverty Among 18-24 Year Olds |
| Immigrants | Switzerland | 0.1 /100 | #277 | Tragic 21.8% |
| Yaqui | 0.1 /100 | #278 | Tragic 21.9% |
| Spanish Americans | 0.1 /100 | #279 | Tragic 21.9% |
| Immigrants | Dominica | 0.1 /100 | #280 | Tragic 21.9% |
| Immigrants | Dominican Republic | 0.1 /100 | #281 | Tragic 21.9% |
| Bermudans | 0.1 /100 | #282 | Tragic 21.9% |
| Sub-Saharan Africans | 0.0 /100 | #283 | Tragic 22.0% |
| Tlingit-Haida | 0.0 /100 | #284 | Tragic 22.0% |
| Ottawa | 0.0 /100 | #285 | Tragic 22.0% |
| Ugandans | 0.0 /100 | #286 | Tragic 22.1% |
| Immigrants | Middle Africa | 0.0 /100 | #287 | Tragic 22.1% |
| Dominicans | 0.0 /100 | #288 | Tragic 22.3% |
| French American Indians | 0.0 /100 | #289 | Tragic 22.3% |
| Immigrants | Senegal | 0.0 /100 | #290 | Tragic 22.4% |
| Bangladeshis | 0.0 /100 | #291 | Tragic 22.5% |
Demographics Similar to Immigrants from Eastern Europe by Female Poverty Among 18-24 Year Olds
In terms of female poverty among 18-24 year olds, the demographic groups most similar to Immigrants from Eastern Europe are Samoan (18.2%, a difference of 0.17%), Bhutanese (18.2%, a difference of 0.28%), Sri Lankan (18.2%, a difference of 0.31%), Immigrants from Ireland (18.3%, a difference of 0.35%), and Asian (18.2%, a difference of 0.36%).
| Demographics | Rating | Rank | Female Poverty Among 18-24 Year Olds |
| Nicaraguans | 100.0 /100 | #44 | Exceptional 18.1% |
| Spanish American Indians | 100.0 /100 | #45 | Exceptional 18.1% |
| Immigrants | Southern Europe | 100.0 /100 | #46 | Exceptional 18.2% |
| Asians | 100.0 /100 | #47 | Exceptional 18.2% |
| Sri Lankans | 100.0 /100 | #48 | Exceptional 18.2% |
| Bhutanese | 100.0 /100 | #49 | Exceptional 18.2% |
| Samoans | 100.0 /100 | #50 | Exceptional 18.2% |
| Immigrants | Eastern Europe | 99.9 /100 | #51 | Exceptional 18.2% |
| Immigrants | Ireland | 99.9 /100 | #52 | Exceptional 18.3% |
| Italians | 99.9 /100 | #53 | Exceptional 18.3% |
| Immigrants | Egypt | 99.9 /100 | #54 | Exceptional 18.4% |
| Albanians | 99.9 /100 | #55 | Exceptional 18.4% |
| Argentineans | 99.9 /100 | #56 | Exceptional 18.4% |
| Immigrants | Italy | 99.9 /100 | #57 | Exceptional 18.4% |
| Immigrants | Ukraine | 99.9 /100 | #58 | Exceptional 18.4% |