Immigrants from Western Africa vs Immigrants from the Azores Female Disability
COMPARE
Immigrants from Western Africa
Immigrants from the Azores
Female Disability
Female Disability Comparison
Immigrants from Western Africa
Immigrants from the Azores
12.3%
FEMALE DISABILITY
29.2/ 100
METRIC RATING
192nd/ 347
METRIC RANK
14.9%
FEMALE DISABILITY
0.0/ 100
METRIC RATING
333rd/ 347
METRIC RANK
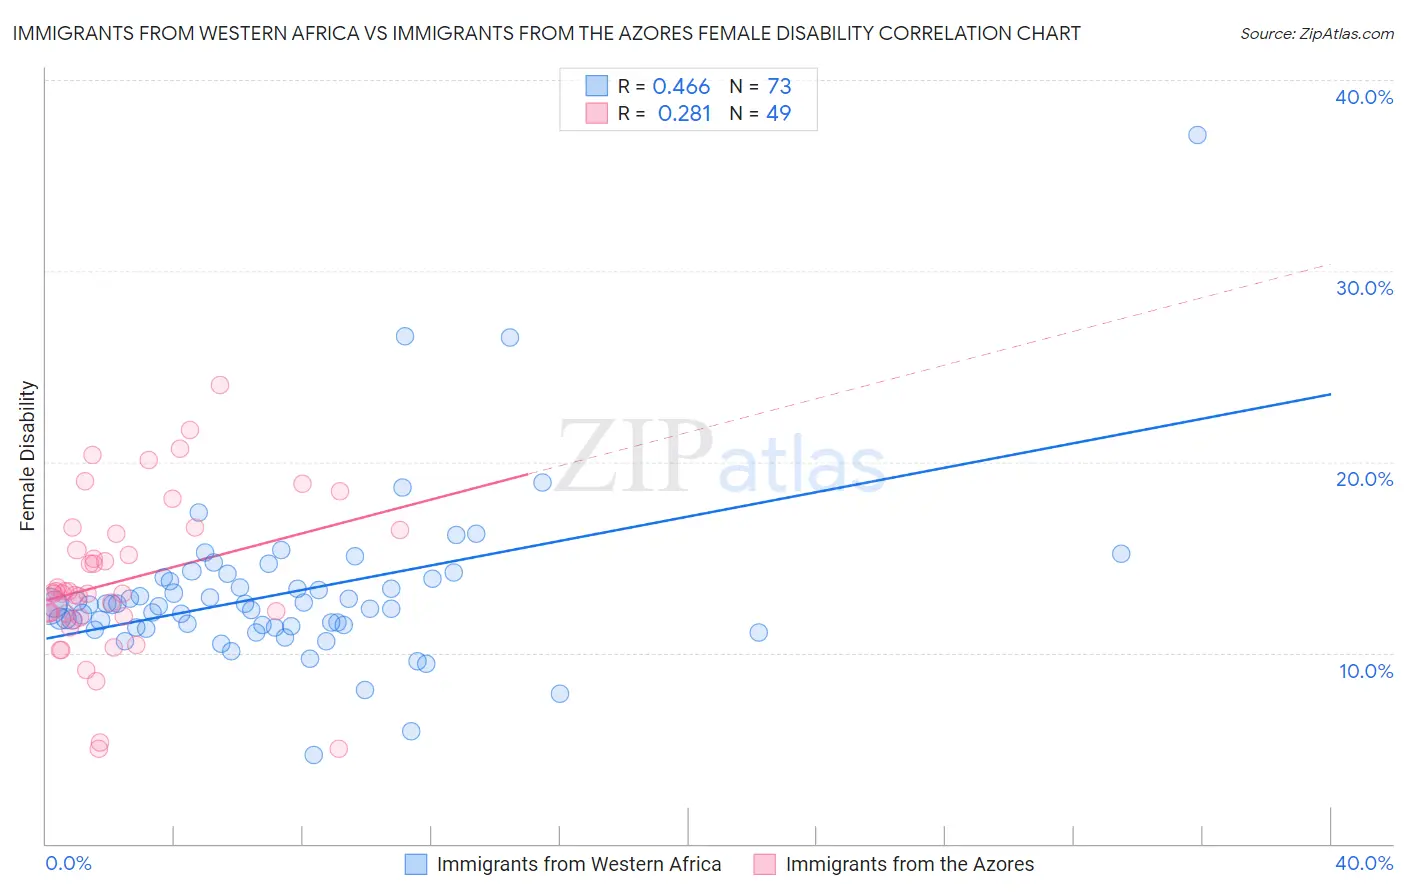
Immigrants from Western Africa vs Immigrants from the Azores Female Disability Correlation Chart
The statistical analysis conducted on geographies consisting of 357,800,651 people shows a moderate positive correlation between the proportion of Immigrants from Western Africa and percentage of females with a disability in the United States with a correlation coefficient (R) of 0.466 and weighted average of 12.3%. Similarly, the statistical analysis conducted on geographies consisting of 46,257,310 people shows a weak positive correlation between the proportion of Immigrants from the Azores and percentage of females with a disability in the United States with a correlation coefficient (R) of 0.281 and weighted average of 14.9%, a difference of 20.8%.
Female Disability Correlation Summary
| Measurement | Immigrants from Western Africa | Immigrants from the Azores |
| Minimum | 4.6% | 5.0% |
| Maximum | 37.1% | 24.0% |
| Range | 32.5% | 19.1% |
| Mean | 13.1% | 13.8% |
| Median | 12.5% | 13.1% |
| Interquartile 25% (IQ1) | 11.3% | 11.9% |
| Interquartile 75% (IQ3) | 13.9% | 16.3% |
| Interquartile Range (IQR) | 2.6% | 4.5% |
| Standard Deviation (Sample) | 4.4% | 4.1% |
| Standard Deviation (Population) | 4.3% | 4.0% |
Similar Demographics by Female Disability
Demographics Similar to Immigrants from Western Africa by Female Disability
In terms of female disability, the demographic groups most similar to Immigrants from Western Africa are Armenian (12.3%, a difference of 0.020%), Northern European (12.3%, a difference of 0.080%), Immigrants from Honduras (12.3%, a difference of 0.090%), Ukrainian (12.3%, a difference of 0.090%), and Immigrants from Albania (12.3%, a difference of 0.10%).
| Demographics | Rating | Rank | Female Disability |
| Immigrants | Uzbekistan | 33.9 /100 | #185 | Fair 12.3% |
| Austrians | 33.3 /100 | #186 | Fair 12.3% |
| Serbians | 33.1 /100 | #187 | Fair 12.3% |
| Immigrants | North America | 32.8 /100 | #188 | Fair 12.3% |
| Immigrants | Albania | 31.6 /100 | #189 | Fair 12.3% |
| Immigrants | Honduras | 31.3 /100 | #190 | Fair 12.3% |
| Armenians | 29.7 /100 | #191 | Fair 12.3% |
| Immigrants | Western Africa | 29.2 /100 | #192 | Fair 12.3% |
| Northern Europeans | 27.5 /100 | #193 | Fair 12.3% |
| Ukrainians | 27.2 /100 | #194 | Fair 12.3% |
| Swedes | 26.6 /100 | #195 | Fair 12.3% |
| Immigrants | Panama | 25.5 /100 | #196 | Fair 12.3% |
| Hondurans | 25.4 /100 | #197 | Fair 12.3% |
| Mexican American Indians | 24.9 /100 | #198 | Fair 12.3% |
| Immigrants | Trinidad and Tobago | 24.7 /100 | #199 | Fair 12.3% |
Demographics Similar to Immigrants from the Azores by Female Disability
In terms of female disability, the demographic groups most similar to Immigrants from the Azores are Cherokee (14.9%, a difference of 0.090%), Cajun (14.9%, a difference of 0.11%), Pima (14.8%, a difference of 0.39%), Seminole (15.0%, a difference of 0.79%), and Tohono O'odham (15.0%, a difference of 0.91%).
| Demographics | Rating | Rank | Female Disability |
| Comanche | 0.0 /100 | #326 | Tragic 14.2% |
| Ottawa | 0.0 /100 | #327 | Tragic 14.2% |
| Cape Verdeans | 0.0 /100 | #328 | Tragic 14.2% |
| Osage | 0.0 /100 | #329 | Tragic 14.3% |
| Yuman | 0.0 /100 | #330 | Tragic 14.5% |
| Immigrants | Cabo Verde | 0.0 /100 | #331 | Tragic 14.6% |
| Pima | 0.0 /100 | #332 | Tragic 14.8% |
| Immigrants | Azores | 0.0 /100 | #333 | Tragic 14.9% |
| Cherokee | 0.0 /100 | #334 | Tragic 14.9% |
| Cajuns | 0.0 /100 | #335 | Tragic 14.9% |
| Seminole | 0.0 /100 | #336 | Tragic 15.0% |
| Tohono O'odham | 0.0 /100 | #337 | Tragic 15.0% |
| Dutch West Indians | 0.0 /100 | #338 | Tragic 15.0% |
| Colville | 0.0 /100 | #339 | Tragic 15.1% |
| Chickasaw | 0.0 /100 | #340 | Tragic 15.2% |