Mongolian vs Chilean Disability Age 65 to 74
COMPARE
Mongolian
Chilean
Disability Age 65 to 74
Disability Age 65 to 74 Comparison
Mongolians
Chileans
21.8%
DISABILITY AGE 65 TO 74
99.0/ 100
METRIC RATING
75th/ 347
METRIC RANK
22.0%
DISABILITY AGE 65 TO 74
97.9/ 100
METRIC RATING
91st/ 347
METRIC RANK
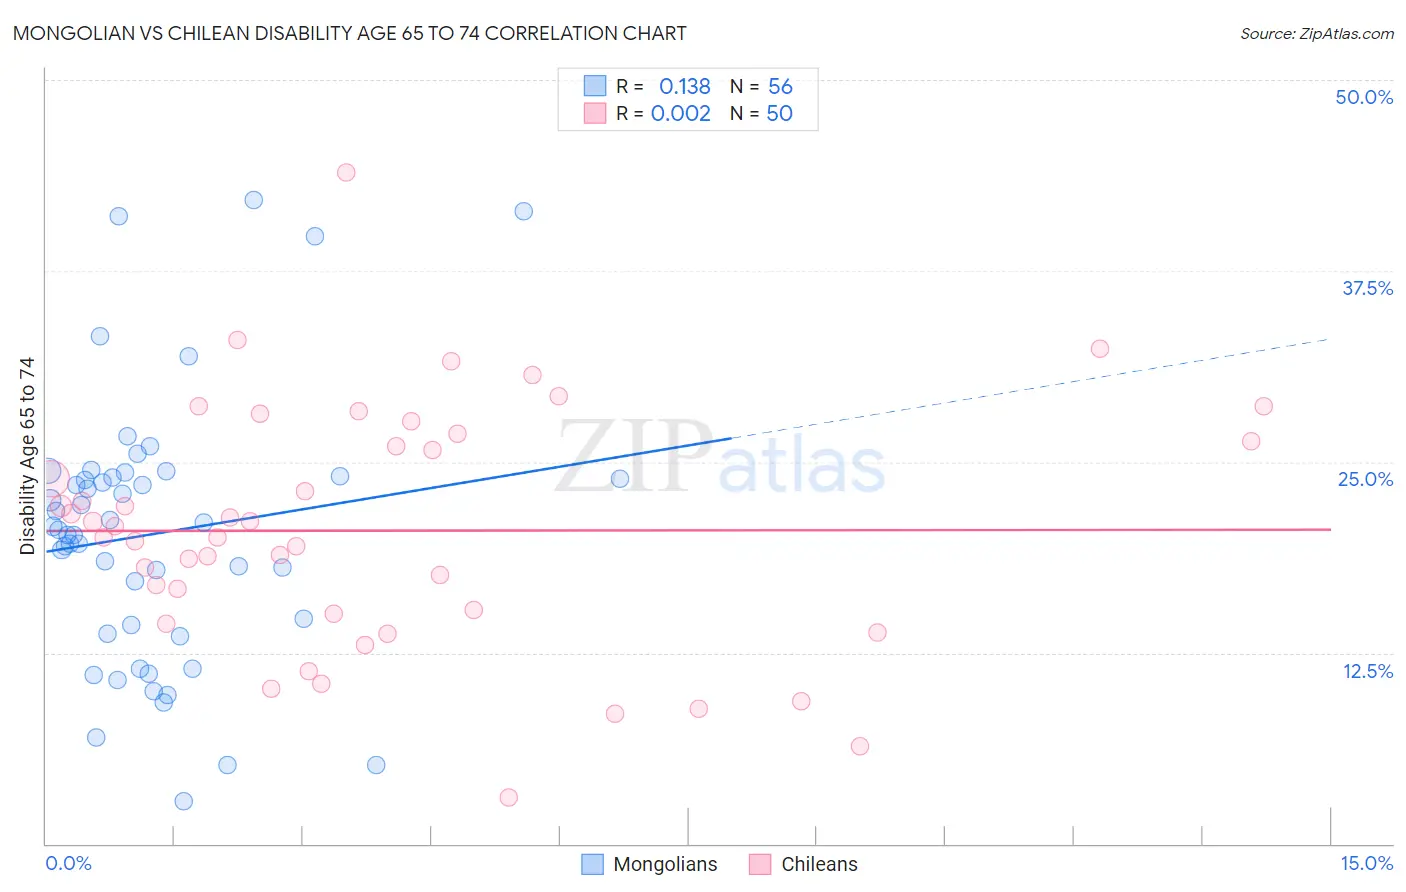
Mongolian vs Chilean Disability Age 65 to 74 Correlation Chart
The statistical analysis conducted on geographies consisting of 140,199,299 people shows a poor positive correlation between the proportion of Mongolians and percentage of population with a disability between the ages 65 and 75 in the United States with a correlation coefficient (R) of 0.138 and weighted average of 21.8%. Similarly, the statistical analysis conducted on geographies consisting of 256,368,241 people shows no correlation between the proportion of Chileans and percentage of population with a disability between the ages 65 and 75 in the United States with a correlation coefficient (R) of 0.002 and weighted average of 22.0%, a difference of 1.2%.
Disability Age 65 to 74 Correlation Summary
| Measurement | Mongolian | Chilean |
| Minimum | 2.8% | 3.0% |
| Maximum | 42.1% | 43.9% |
| Range | 39.3% | 40.9% |
| Mean | 20.3% | 20.5% |
| Median | 20.7% | 20.4% |
| Interquartile 25% (IQ1) | 14.0% | 15.1% |
| Interquartile 75% (IQ3) | 24.0% | 26.3% |
| Interquartile Range (IQR) | 10.0% | 11.2% |
| Standard Deviation (Sample) | 8.7% | 8.0% |
| Standard Deviation (Population) | 8.7% | 7.9% |
Demographics Similar to Mongolians and Chileans by Disability Age 65 to 74
In terms of disability age 65 to 74, the demographic groups most similar to Mongolians are Greek (21.8%, a difference of 0.010%), Cambodian (21.8%, a difference of 0.020%), Immigrants from Venezuela (21.8%, a difference of 0.030%), Immigrants from Poland (21.8%, a difference of 0.070%), and Immigrants from Eastern Europe (21.8%, a difference of 0.12%). Similarly, the demographic groups most similar to Chileans are Italian (22.0%, a difference of 0.020%), Immigrants from Kuwait (22.0%, a difference of 0.030%), Immigrants from Netherlands (22.0%, a difference of 0.040%), Australian (22.0%, a difference of 0.050%), and Polish (22.0%, a difference of 0.060%).
| Demographics | Rating | Rank | Disability Age 65 to 74 |
| Immigrants | Venezuela | 99.0 /100 | #73 | Exceptional 21.8% |
| Cambodians | 99.0 /100 | #74 | Exceptional 21.8% |
| Mongolians | 99.0 /100 | #75 | Exceptional 21.8% |
| Greeks | 99.0 /100 | #76 | Exceptional 21.8% |
| Immigrants | Poland | 99.0 /100 | #77 | Exceptional 21.8% |
| Immigrants | Eastern Europe | 99.0 /100 | #78 | Exceptional 21.8% |
| Venezuelans | 99.0 /100 | #79 | Exceptional 21.8% |
| Immigrants | Norway | 98.9 /100 | #80 | Exceptional 21.8% |
| Croatians | 98.9 /100 | #81 | Exceptional 21.8% |
| Immigrants | Indonesia | 98.7 /100 | #82 | Exceptional 21.9% |
| Immigrants | Brazil | 98.5 /100 | #83 | Exceptional 21.9% |
| Immigrants | Spain | 98.5 /100 | #84 | Exceptional 21.9% |
| Immigrants | Lebanon | 98.4 /100 | #85 | Exceptional 21.9% |
| South Africans | 98.4 /100 | #86 | Exceptional 21.9% |
| Australians | 98.0 /100 | #87 | Exceptional 22.0% |
| Immigrants | Netherlands | 97.9 /100 | #88 | Exceptional 22.0% |
| Immigrants | Kuwait | 97.9 /100 | #89 | Exceptional 22.0% |
| Italians | 97.9 /100 | #90 | Exceptional 22.0% |
| Chileans | 97.9 /100 | #91 | Exceptional 22.0% |
| Poles | 97.8 /100 | #92 | Exceptional 22.0% |
| Immigrants | Canada | 97.8 /100 | #93 | Exceptional 22.1% |