Seminole vs Belgian Disability Age 65 to 74
COMPARE
Seminole
Belgian
Disability Age 65 to 74
Disability Age 65 to 74 Comparison
Seminole
Belgians
29.4%
DISABILITY AGE 65 TO 74
0.0/ 100
METRIC RATING
324th/ 347
METRIC RANK
22.7%
DISABILITY AGE 65 TO 74
85.3/ 100
METRIC RATING
141st/ 347
METRIC RANK
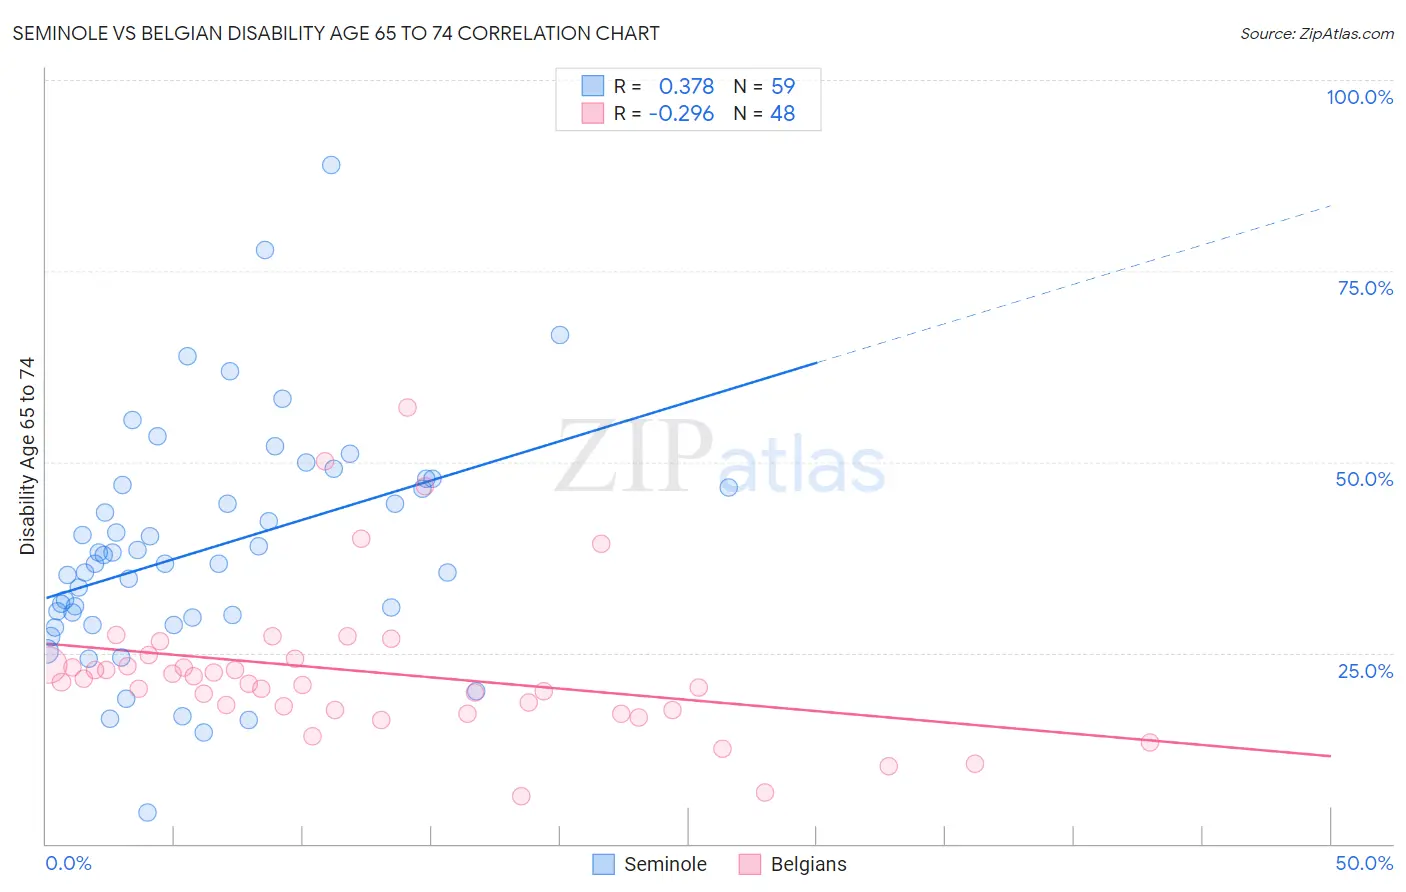
Seminole vs Belgian Disability Age 65 to 74 Correlation Chart
The statistical analysis conducted on geographies consisting of 118,257,579 people shows a mild positive correlation between the proportion of Seminole and percentage of population with a disability between the ages 65 and 75 in the United States with a correlation coefficient (R) of 0.378 and weighted average of 29.4%. Similarly, the statistical analysis conducted on geographies consisting of 355,442,637 people shows a weak negative correlation between the proportion of Belgians and percentage of population with a disability between the ages 65 and 75 in the United States with a correlation coefficient (R) of -0.296 and weighted average of 22.7%, a difference of 29.4%.
Disability Age 65 to 74 Correlation Summary
| Measurement | Seminole | Belgian |
| Minimum | 4.1% | 6.1% |
| Maximum | 88.9% | 57.1% |
| Range | 84.8% | 51.0% |
| Mean | 38.6% | 22.5% |
| Median | 36.7% | 21.0% |
| Interquartile 25% (IQ1) | 29.6% | 17.5% |
| Interquartile 75% (IQ3) | 46.9% | 23.8% |
| Interquartile Range (IQR) | 17.3% | 6.3% |
| Standard Deviation (Sample) | 15.3% | 9.9% |
| Standard Deviation (Population) | 15.2% | 9.8% |
Similar Demographics by Disability Age 65 to 74
Demographics Similar to Seminole by Disability Age 65 to 74
In terms of disability age 65 to 74, the demographic groups most similar to Seminole are Dutch West Indian (29.6%, a difference of 0.45%), Yakama (29.6%, a difference of 0.68%), Apache (29.7%, a difference of 0.83%), Puerto Rican (29.1%, a difference of 0.97%), and Hopi (30.0%, a difference of 1.8%).
| Demographics | Rating | Rank | Disability Age 65 to 74 |
| Immigrants | Armenia | 0.0 /100 | #317 | Tragic 28.0% |
| Nepalese | 0.0 /100 | #318 | Tragic 28.0% |
| Arapaho | 0.0 /100 | #319 | Tragic 28.1% |
| Cherokee | 0.0 /100 | #320 | Tragic 28.2% |
| Comanche | 0.0 /100 | #321 | Tragic 28.3% |
| Aleuts | 0.0 /100 | #322 | Tragic 28.4% |
| Puerto Ricans | 0.0 /100 | #323 | Tragic 29.1% |
| Seminole | 0.0 /100 | #324 | Tragic 29.4% |
| Dutch West Indians | 0.0 /100 | #325 | Tragic 29.6% |
| Yakama | 0.0 /100 | #326 | Tragic 29.6% |
| Apache | 0.0 /100 | #327 | Tragic 29.7% |
| Hopi | 0.0 /100 | #328 | Tragic 30.0% |
| Choctaw | 0.0 /100 | #329 | Tragic 30.2% |
| Creek | 0.0 /100 | #330 | Tragic 30.2% |
| Chickasaw | 0.0 /100 | #331 | Tragic 30.2% |
Demographics Similar to Belgians by Disability Age 65 to 74
In terms of disability age 65 to 74, the demographic groups most similar to Belgians are Ugandan (22.7%, a difference of 0.010%), Immigrants from Ethiopia (22.7%, a difference of 0.010%), Immigrants from Syria (22.7%, a difference of 0.050%), Arab (22.8%, a difference of 0.070%), and Danish (22.8%, a difference of 0.11%).
| Demographics | Rating | Rank | Disability Age 65 to 74 |
| Afghans | 88.6 /100 | #134 | Excellent 22.6% |
| Immigrants | Ukraine | 88.4 /100 | #135 | Excellent 22.6% |
| Ethiopians | 87.9 /100 | #136 | Excellent 22.7% |
| Taiwanese | 87.6 /100 | #137 | Excellent 22.7% |
| Immigrants | Moldova | 87.3 /100 | #138 | Excellent 22.7% |
| Immigrants | Syria | 85.8 /100 | #139 | Excellent 22.7% |
| Ugandans | 85.4 /100 | #140 | Excellent 22.7% |
| Belgians | 85.3 /100 | #141 | Excellent 22.7% |
| Immigrants | Ethiopia | 85.3 /100 | #142 | Excellent 22.7% |
| Arabs | 84.8 /100 | #143 | Excellent 22.8% |
| Danes | 84.4 /100 | #144 | Excellent 22.8% |
| Immigrants | Uganda | 84.0 /100 | #145 | Excellent 22.8% |
| Alsatians | 83.7 /100 | #146 | Excellent 22.8% |
| Immigrants | Uzbekistan | 83.1 /100 | #147 | Excellent 22.8% |
| New Zealanders | 79.9 /100 | #148 | Good 22.9% |