Taiwanese vs Immigrants from Lithuania Disability Age Under 5
COMPARE
Taiwanese
Immigrants from Lithuania
Disability Age Under 5
Disability Age Under 5 Comparison
Taiwanese
Immigrants from Lithuania
1.3%
DISABILITY AGE UNDER 5
6.1/ 100
METRIC RATING
227th/ 347
METRIC RANK
1.3%
DISABILITY AGE UNDER 5
27.2/ 100
METRIC RATING
200th/ 347
METRIC RANK
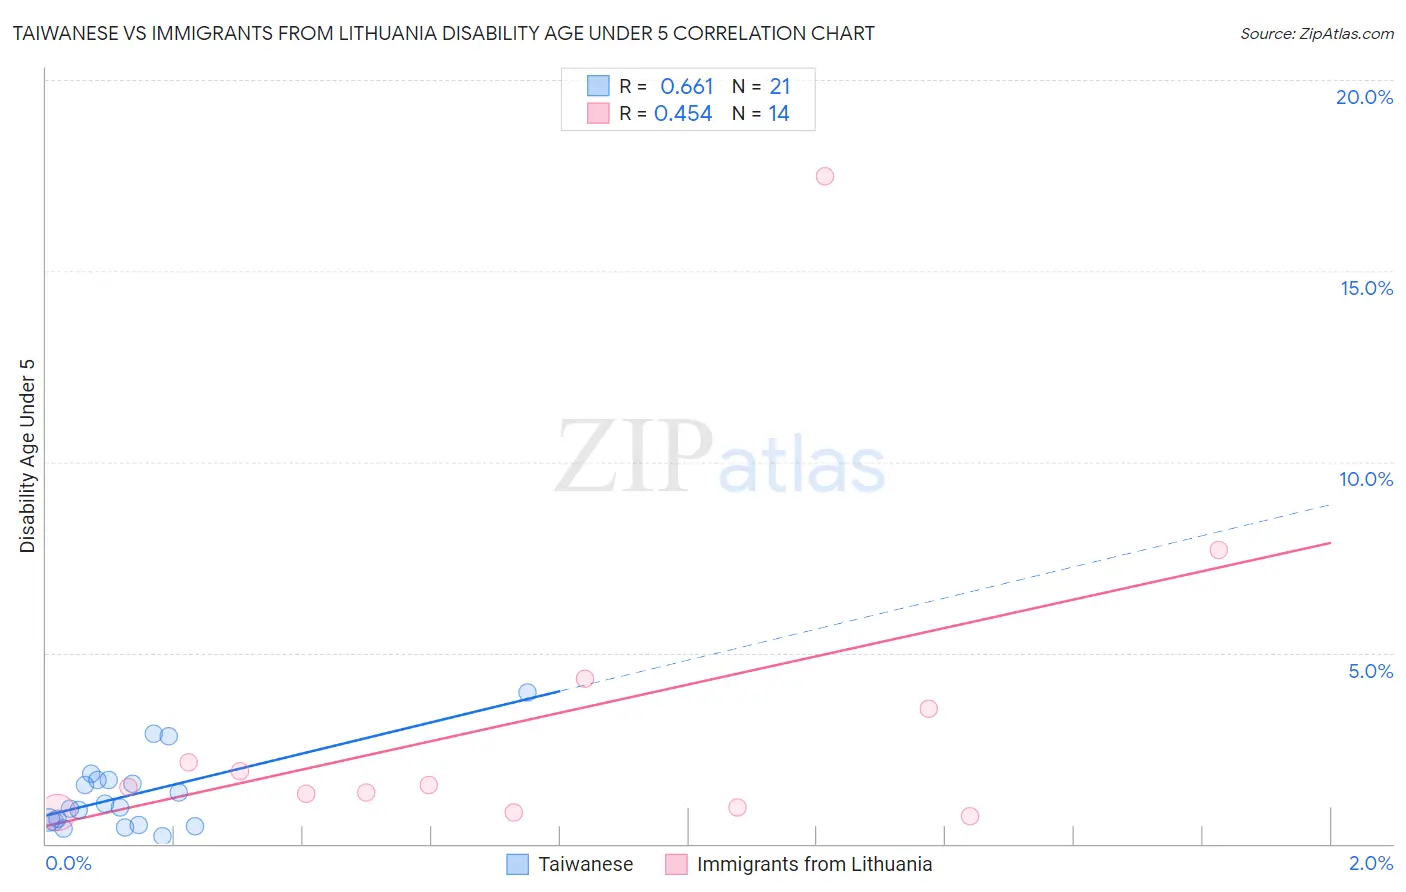
Taiwanese vs Immigrants from Lithuania Disability Age Under 5 Correlation Chart
The statistical analysis conducted on geographies consisting of 29,016,682 people shows a significant positive correlation between the proportion of Taiwanese and percentage of population with a disability under the age of 5 in the United States with a correlation coefficient (R) of 0.661 and weighted average of 1.3%. Similarly, the statistical analysis conducted on geographies consisting of 85,421,009 people shows a moderate positive correlation between the proportion of Immigrants from Lithuania and percentage of population with a disability under the age of 5 in the United States with a correlation coefficient (R) of 0.454 and weighted average of 1.3%, a difference of 3.9%.
Disability Age Under 5 Correlation Summary
| Measurement | Taiwanese | Immigrants from Lithuania |
| Minimum | 0.21% | 0.71% |
| Maximum | 4.0% | 17.5% |
| Range | 3.7% | 16.8% |
| Mean | 1.3% | 3.3% |
| Median | 0.96% | 1.5% |
| Interquartile 25% (IQ1) | 0.53% | 0.96% |
| Interquartile 75% (IQ3) | 1.7% | 3.5% |
| Interquartile Range (IQR) | 1.1% | 2.6% |
| Standard Deviation (Sample) | 0.96% | 4.5% |
| Standard Deviation (Population) | 0.94% | 4.3% |
Similar Demographics by Disability Age Under 5
Demographics Similar to Taiwanese by Disability Age Under 5
In terms of disability age under 5, the demographic groups most similar to Taiwanese are Luxembourger (1.3%, a difference of 0.010%), Immigrants from Costa Rica (1.3%, a difference of 0.23%), Lebanese (1.3%, a difference of 0.32%), Panamanian (1.3%, a difference of 0.34%), and Bahamian (1.3%, a difference of 0.34%).
| Demographics | Rating | Rank | Disability Age Under 5 |
| Serbians | 9.6 /100 | #220 | Tragic 1.3% |
| Sub-Saharan Africans | 8.3 /100 | #221 | Tragic 1.3% |
| Ukrainians | 8.3 /100 | #222 | Tragic 1.3% |
| Hispanics or Latinos | 7.7 /100 | #223 | Tragic 1.3% |
| Latvians | 7.1 /100 | #224 | Tragic 1.3% |
| Panamanians | 7.1 /100 | #225 | Tragic 1.3% |
| Bahamians | 7.1 /100 | #226 | Tragic 1.3% |
| Taiwanese | 6.1 /100 | #227 | Tragic 1.3% |
| Luxembourgers | 6.1 /100 | #228 | Tragic 1.3% |
| Immigrants | Costa Rica | 5.5 /100 | #229 | Tragic 1.3% |
| Lebanese | 5.3 /100 | #230 | Tragic 1.3% |
| Immigrants | Northern Europe | 4.7 /100 | #231 | Tragic 1.3% |
| French American Indians | 4.5 /100 | #232 | Tragic 1.3% |
| Tongans | 4.2 /100 | #233 | Tragic 1.3% |
| Pueblo | 3.8 /100 | #234 | Tragic 1.3% |
Demographics Similar to Immigrants from Lithuania by Disability Age Under 5
In terms of disability age under 5, the demographic groups most similar to Immigrants from Lithuania are Immigrants from Italy (1.3%, a difference of 0.20%), Arapaho (1.3%, a difference of 0.35%), Liberian (1.3%, a difference of 0.37%), Jamaican (1.3%, a difference of 0.38%), and Immigrants from Europe (1.3%, a difference of 0.41%).
| Demographics | Rating | Rank | Disability Age Under 5 |
| Immigrants | Sierra Leone | 36.5 /100 | #193 | Fair 1.3% |
| Immigrants | North Macedonia | 34.7 /100 | #194 | Fair 1.3% |
| U.S. Virgin Islanders | 34.4 /100 | #195 | Fair 1.3% |
| Immigrants | Belgium | 31.4 /100 | #196 | Fair 1.3% |
| Immigrants | Somalia | 31.3 /100 | #197 | Fair 1.3% |
| Immigrants | Norway | 31.1 /100 | #198 | Fair 1.3% |
| Jamaicans | 30.7 /100 | #199 | Fair 1.3% |
| Immigrants | Lithuania | 27.2 /100 | #200 | Fair 1.3% |
| Immigrants | Italy | 25.4 /100 | #201 | Fair 1.3% |
| Arapaho | 24.1 /100 | #202 | Fair 1.3% |
| Liberians | 24.0 /100 | #203 | Fair 1.3% |
| Immigrants | Europe | 23.6 /100 | #204 | Fair 1.3% |
| Romanians | 22.5 /100 | #205 | Fair 1.3% |
| Immigrants | Poland | 22.4 /100 | #206 | Fair 1.3% |
| Nigerians | 21.2 /100 | #207 | Fair 1.3% |