Immigrants from Bahamas vs Immigrants from Lithuania Disability Age Under 5
COMPARE
Immigrants from Bahamas
Immigrants from Lithuania
Disability Age Under 5
Disability Age Under 5 Comparison
Immigrants from Bahamas
Immigrants from Lithuania
1.2%
DISABILITY AGE UNDER 5
45.2/ 100
METRIC RATING
179th/ 347
METRIC RANK
1.3%
DISABILITY AGE UNDER 5
27.2/ 100
METRIC RATING
200th/ 347
METRIC RANK
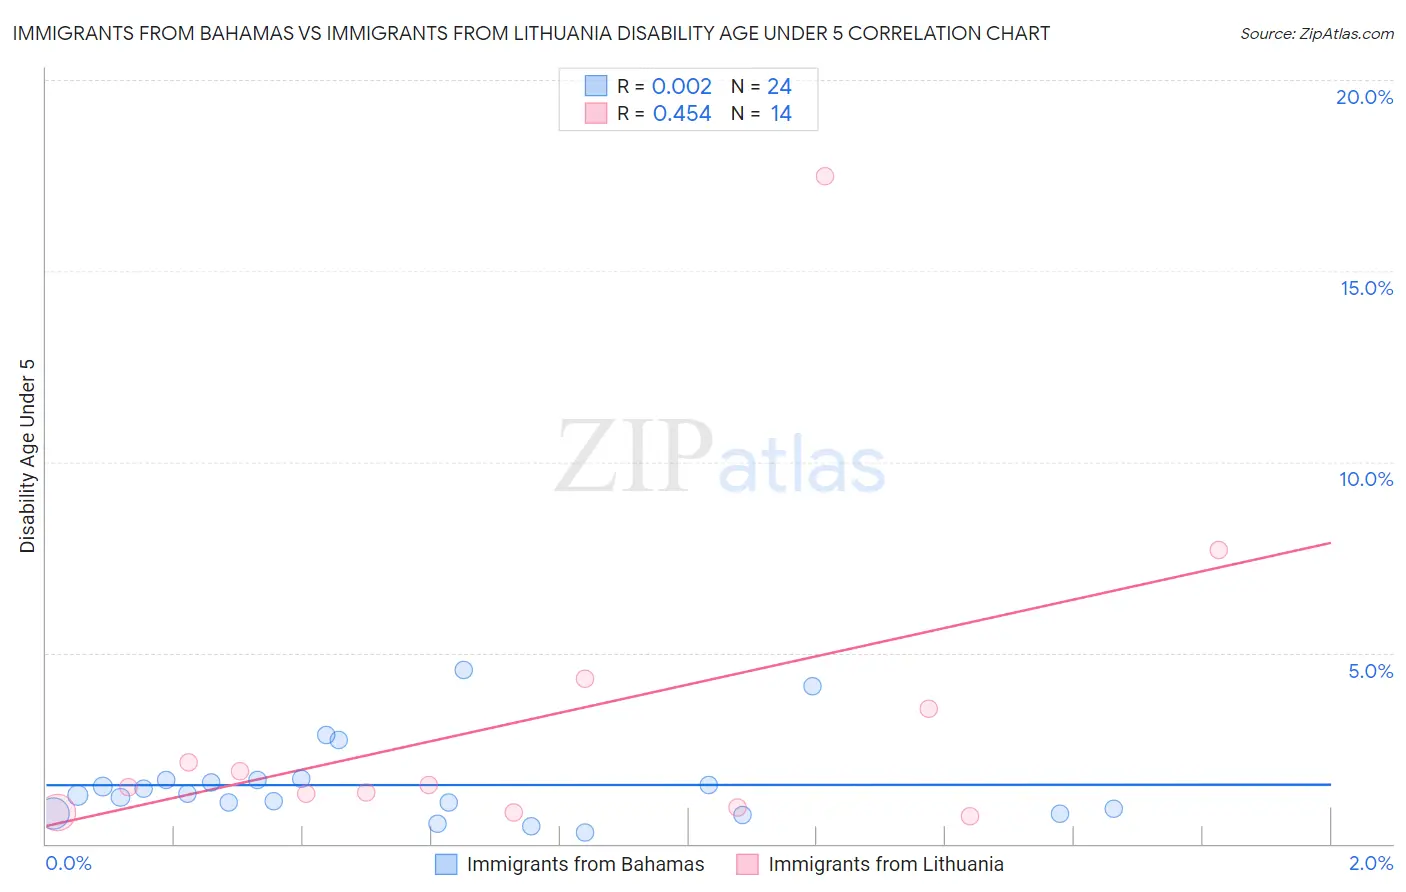
Immigrants from Bahamas vs Immigrants from Lithuania Disability Age Under 5 Correlation Chart
The statistical analysis conducted on geographies consisting of 77,902,509 people shows no correlation between the proportion of Immigrants from Bahamas and percentage of population with a disability under the age of 5 in the United States with a correlation coefficient (R) of 0.002 and weighted average of 1.2%. Similarly, the statistical analysis conducted on geographies consisting of 85,421,009 people shows a moderate positive correlation between the proportion of Immigrants from Lithuania and percentage of population with a disability under the age of 5 in the United States with a correlation coefficient (R) of 0.454 and weighted average of 1.3%, a difference of 1.8%.
Disability Age Under 5 Correlation Summary
| Measurement | Immigrants from Bahamas | Immigrants from Lithuania |
| Minimum | 0.28% | 0.71% |
| Maximum | 4.6% | 17.5% |
| Range | 4.3% | 16.8% |
| Mean | 1.5% | 3.3% |
| Median | 1.3% | 1.5% |
| Interquartile 25% (IQ1) | 0.85% | 0.96% |
| Interquartile 75% (IQ3) | 1.7% | 3.5% |
| Interquartile Range (IQR) | 0.82% | 2.6% |
| Standard Deviation (Sample) | 1.1% | 4.5% |
| Standard Deviation (Population) | 1.0% | 4.3% |
Similar Demographics by Disability Age Under 5
Demographics Similar to Immigrants from Bahamas by Disability Age Under 5
In terms of disability age under 5, the demographic groups most similar to Immigrants from Bahamas are Immigrants from Mexico (1.2%, a difference of 0.070%), Immigrants from Peru (1.2%, a difference of 0.13%), Macedonian (1.2%, a difference of 0.13%), Venezuelan (1.2%, a difference of 0.17%), and Immigrants from Saudi Arabia (1.2%, a difference of 0.17%).
| Demographics | Rating | Rank | Disability Age Under 5 |
| Crow | 51.0 /100 | #172 | Average 1.2% |
| Immigrants | Ireland | 50.3 /100 | #173 | Average 1.2% |
| Immigrants | Latvia | 50.0 /100 | #174 | Average 1.2% |
| Immigrants | Nigeria | 50.0 /100 | #175 | Average 1.2% |
| Immigrants | Kenya | 48.6 /100 | #176 | Average 1.2% |
| Comanche | 47.5 /100 | #177 | Average 1.2% |
| Venezuelans | 47.1 /100 | #178 | Average 1.2% |
| Immigrants | Bahamas | 45.2 /100 | #179 | Average 1.2% |
| Immigrants | Mexico | 44.4 /100 | #180 | Average 1.2% |
| Immigrants | Peru | 43.7 /100 | #181 | Average 1.2% |
| Macedonians | 43.7 /100 | #181 | Average 1.2% |
| Immigrants | Saudi Arabia | 43.3 /100 | #183 | Average 1.2% |
| Palestinians | 43.0 /100 | #184 | Average 1.2% |
| Immigrants | Western Africa | 42.5 /100 | #185 | Average 1.2% |
| Cubans | 42.5 /100 | #186 | Average 1.2% |
Demographics Similar to Immigrants from Lithuania by Disability Age Under 5
In terms of disability age under 5, the demographic groups most similar to Immigrants from Lithuania are Immigrants from Italy (1.3%, a difference of 0.20%), Arapaho (1.3%, a difference of 0.35%), Liberian (1.3%, a difference of 0.37%), Jamaican (1.3%, a difference of 0.38%), and Immigrants from Europe (1.3%, a difference of 0.41%).
| Demographics | Rating | Rank | Disability Age Under 5 |
| Immigrants | Sierra Leone | 36.5 /100 | #193 | Fair 1.3% |
| Immigrants | North Macedonia | 34.7 /100 | #194 | Fair 1.3% |
| U.S. Virgin Islanders | 34.4 /100 | #195 | Fair 1.3% |
| Immigrants | Belgium | 31.4 /100 | #196 | Fair 1.3% |
| Immigrants | Somalia | 31.3 /100 | #197 | Fair 1.3% |
| Immigrants | Norway | 31.1 /100 | #198 | Fair 1.3% |
| Jamaicans | 30.7 /100 | #199 | Fair 1.3% |
| Immigrants | Lithuania | 27.2 /100 | #200 | Fair 1.3% |
| Immigrants | Italy | 25.4 /100 | #201 | Fair 1.3% |
| Arapaho | 24.1 /100 | #202 | Fair 1.3% |
| Liberians | 24.0 /100 | #203 | Fair 1.3% |
| Immigrants | Europe | 23.6 /100 | #204 | Fair 1.3% |
| Romanians | 22.5 /100 | #205 | Fair 1.3% |
| Immigrants | Poland | 22.4 /100 | #206 | Fair 1.3% |
| Nigerians | 21.2 /100 | #207 | Fair 1.3% |