Taiwanese vs Immigrants from Colombia Disability Age Under 5

COMPARE

Taiwanese
Race
Ancestry
AfghanAfricanAlaska NativeAlaskan AthabascanAlbanianAleutAlsatianAmericanApacheArabArapahoArgentineanArmenianAssyrian/Chaldean/SyriacAustralianAustrianBahamianBangladeshiBarbadianBasqueBelgianBelizeanBermudanBhutaneseBlackfeetBolivianBrazilianBritishBritish West IndianBulgarianBurmeseCajunCambodianCanadianCape VerdeanCarpatho RusynCelticCentral AmericanCentral American IndianCherokeeCheyenneChickasawChileanChineseChippewaChoctawColombianColvilleComancheCosta RicanCreeCreekCroatianCrowCubanCypriotCzechCzechoslovakianDanishDelawareDominicanDutchDutch West IndianEastern EuropeanEcuadorianEgyptianEnglishEstonianEthiopianEuropeanFijianFilipinoFinnishFrenchFrench American IndianFrench CanadianGermanGerman RussianGhanaianGreekGuamanian/ChamorroGuatemalanGuyaneseHaitianHmongHonduranHopiHoumaHungarianIcelanderIndian (Asian)IndonesianInupiatIranianIraqiIrishIroquoisIsraeliItalianJamaicanJapaneseJordanianKenyanKiowaKoreanLaotianLatvianLebaneseLiberianLithuanianLumbeeLuxembourgerMacedonianMalaysianMalteseMarshalleseMenomineeMexicanMexican American IndianMongolianMoroccanNative HawaiianNavajoNepaleseNew ZealanderNicaraguanNigerianNorthern EuropeanNorwegianOkinawanOsageOttawaPaiutePakistaniPalestinianPanamanianParaguayanPennsylvania GermanPeruvianPimaPolishPortuguesePotawatomiPuebloPuerto RicanPuget Sound SalishRomanianRussianSalvadoranSamoanScandinavianScotch-IrishScottishSeminoleSenegaleseSerbianShoshoneSierra LeoneanSiouxSlavicSlovakSloveneSomaliSouth AfricanSouth AmericanSouth American IndianSoviet UnionSpaniardSpanishSpanish AmericanSpanish American IndianSri LankanSubsaharan AfricanSudaneseSwedishSwissSyrianTaiwaneseThaiTlingit-HaidaTohono O'OdhamTonganTrinidadian and TobagonianTsimshianTurkishU.S. Virgin IslanderUgandanUkrainianUruguayanUteVenezuelanVietnameseWelshWest IndianYakamaYaquiYugoslavianYumanYup'ikZimbabwean
Immigration
NonimmigrantsImmigrantsAfghanistanAfricaAlbaniaArgentinaArmeniaAsiaAustraliaAustriaBahamasBangladeshBarbadosBelarusBelgiumBelizeBoliviaBosnia and HerzegovinaBrazilBulgariaBurma/MyanmarCabo VerdeCambodiaCameroonCanadaCaribbeanCentral AmericaChileChinaCongoCosta RicaCroatiaCubaCzechoslovakiaDenmarkDominicaDominican RepublicEastern AfricaEastern AsiaEastern EuropeEcuadorEgyptEl SalvadorEnglandEritreaEthiopiaEuropeFijiFranceGermanyGhanaGreeceGrenadaGuatemalaGuyanaHaitiHondurasHong KongHungaryIndiaIndonesiaIranIraqIrelandIsraelItalyJamaicaJapanJordanKazakhstanKenyaKoreaKuwaitLaosLatin AmericaLatviaLebanonLiberiaLithuaniaMalaysiaMexicoMicronesiaMiddle AfricaMoldovaMoroccoNepalNetherlandsNicaraguaNigeriaNorth AmericaNorth MacedoniaNorthern AfricaNorthern EuropeNorwayOceaniaPakistanPanamaPeruPhilippinesPolandPortugalRomaniaRussiaSaudi ArabiaScotlandSenegalSerbiaSierra LeoneSingaporeSomaliaSouth AfricaSouth AmericaSouth Central AsiaSouth Eastern AsiaSouthern EuropeSpainSri LankaSt. Vincent and the GrenadinesSudanSwedenSwitzerlandSyriaTaiwanThailandTrinidad and TobagoTurkeyUgandaUkraineUruguayUzbekistanVenezuelaVietnamWest IndiesWestern AfricaWestern AsiaWestern EuropeYemenZaireZimbabweAzores
Immigrants from Colombia
Race
Ancestry
AfghanAfricanAlaska NativeAlaskan AthabascanAlbanianAleutAlsatianAmericanApacheArabArapahoArgentineanArmenianAssyrian/Chaldean/SyriacAustralianAustrianBahamianBangladeshiBarbadianBasqueBelgianBelizeanBermudanBhutaneseBlackfeetBolivianBrazilianBritishBritish West IndianBulgarianBurmeseCajunCambodianCanadianCape VerdeanCarpatho RusynCelticCentral AmericanCentral American IndianCherokeeCheyenneChickasawChileanChineseChippewaChoctawColombianColvilleComancheCosta RicanCreeCreekCroatianCrowCubanCypriotCzechCzechoslovakianDanishDelawareDominicanDutchDutch West IndianEastern EuropeanEcuadorianEgyptianEnglishEstonianEthiopianEuropeanFijianFilipinoFinnishFrenchFrench American IndianFrench CanadianGermanGerman RussianGhanaianGreekGuamanian/ChamorroGuatemalanGuyaneseHaitianHmongHonduranHopiHoumaHungarianIcelanderIndian (Asian)IndonesianInupiatIranianIraqiIrishIroquoisIsraeliItalianJamaicanJapaneseJordanianKenyanKiowaKoreanLaotianLatvianLebaneseLiberianLithuanianLumbeeLuxembourgerMacedonianMalaysianMalteseMarshalleseMenomineeMexicanMexican American IndianMongolianMoroccanNative HawaiianNavajoNepaleseNew ZealanderNicaraguanNigerianNorthern EuropeanNorwegianOkinawanOsageOttawaPaiutePakistaniPalestinianPanamanianParaguayanPennsylvania GermanPeruvianPimaPolishPortuguesePotawatomiPuebloPuerto RicanPuget Sound SalishRomanianRussianSalvadoranSamoanScandinavianScotch-IrishScottishSeminoleSenegaleseSerbianShoshoneSierra LeoneanSiouxSlavicSlovakSloveneSomaliSouth AfricanSouth AmericanSouth American IndianSoviet UnionSpaniardSpanishSpanish AmericanSpanish American IndianSri LankanSubsaharan AfricanSudaneseSwedishSwissSyrianThaiTlingit-HaidaTohono O'OdhamTonganTrinidadian and TobagonianTsimshianTurkishU.S. Virgin IslanderUgandanUkrainianUruguayanUteVenezuelanVietnameseWelshWest IndianYakamaYaquiYugoslavianYumanYup'ikZimbabwean
Immigration
NonimmigrantsImmigrantsAfghanistanAfricaAlbaniaArgentinaArmeniaAsiaAustraliaAustriaBahamasBangladeshBarbadosBelarusBelgiumBelizeBoliviaBosnia and HerzegovinaBrazilBulgariaBurma/MyanmarCabo VerdeCambodiaCameroonCanadaCaribbeanCentral AmericaChileChinaColombiaCongoCosta RicaCroatiaCubaCzechoslovakiaDenmarkDominicaDominican RepublicEastern AfricaEastern AsiaEastern EuropeEcuadorEgyptEl SalvadorEnglandEritreaEthiopiaEuropeFijiFranceGermanyGhanaGreeceGrenadaGuatemalaGuyanaHaitiHondurasHong KongHungaryIndiaIndonesiaIranIraqIrelandIsraelItalyJamaicaJapanJordanKazakhstanKenyaKoreaKuwaitLaosLatin AmericaLatviaLebanonLiberiaLithuaniaMalaysiaMexicoMicronesiaMiddle AfricaMoldovaMoroccoNepalNetherlandsNicaraguaNigeriaNorth AmericaNorth MacedoniaNorthern AfricaNorthern EuropeNorwayOceaniaPakistanPanamaPeruPhilippinesPolandPortugalRomaniaRussiaSaudi ArabiaScotlandSenegalSerbiaSierra LeoneSingaporeSomaliaSouth AfricaSouth AmericaSouth Central AsiaSouth Eastern AsiaSouthern EuropeSpainSri LankaSt. Vincent and the GrenadinesSudanSwedenSwitzerlandSyriaTaiwanThailandTrinidad and TobagoTurkeyUgandaUkraineUruguayUzbekistanVenezuelaVietnamWest IndiesWestern AfricaWestern AsiaWestern EuropeYemenZaireZimbabweAzores
Disability Age Under 5
Income
Poverty
Unemployment
Labor Participation
Family Structure
Vehicle Availability
Education Level
Disability

Disability Age Under 5 Comparison

Taiwanese

Immigrants from Colombia

Tragic
Good
1.3%
DISABILITY AGE UNDER 5
6.1/ 100
METRIC RATING
227th/ 347
METRIC RANK
1.2%
DISABILITY AGE UNDER 5
79.3/ 100
METRIC RATING
142nd/ 347
METRIC RANK

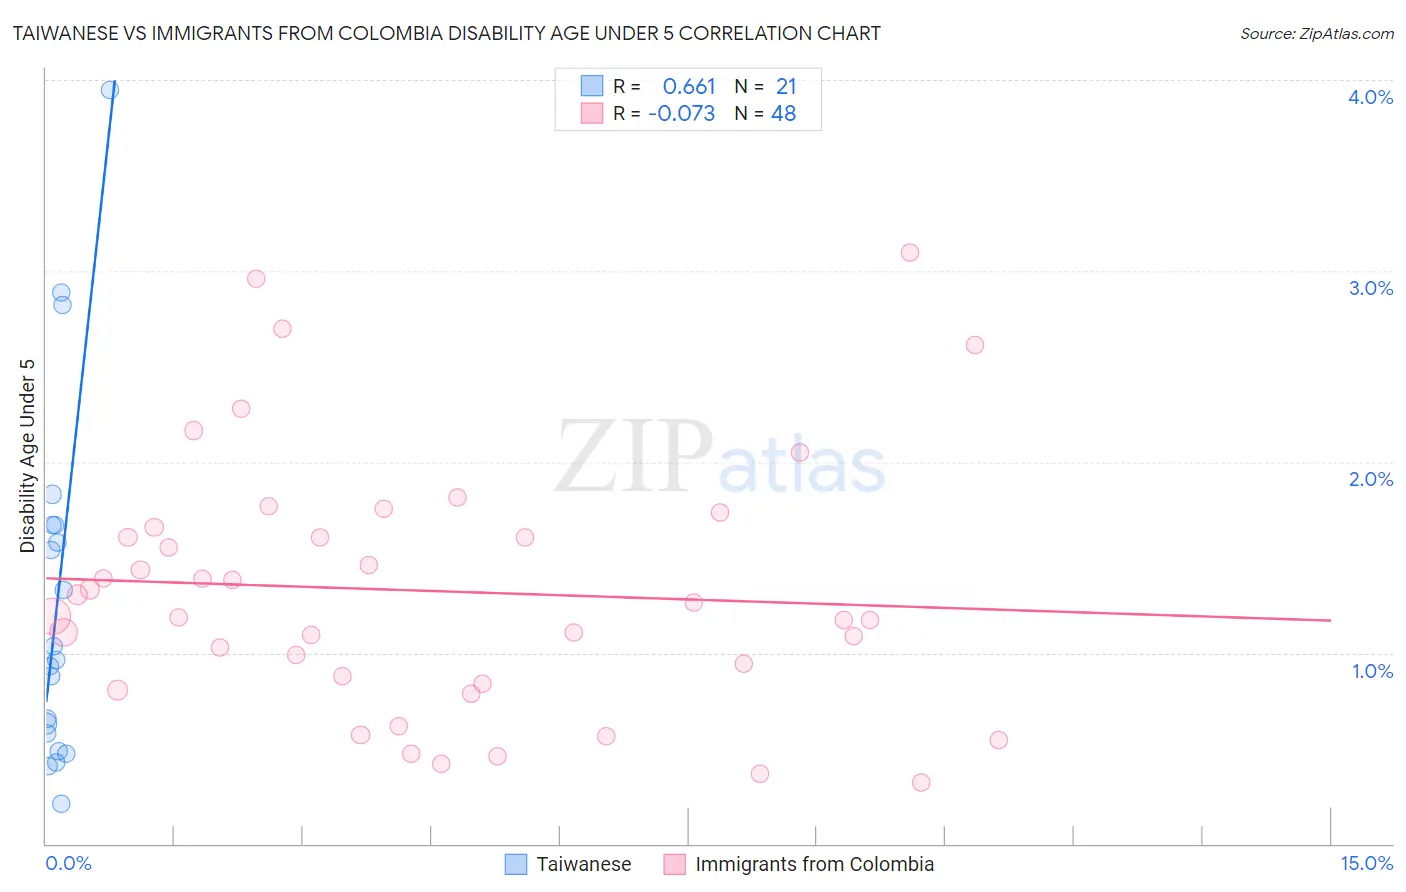
Taiwanese vs Immigrants from Colombia Disability Age Under 5 Correlation Chart

The statistical analysis conducted on geographies consisting of 29,016,682 people shows a significant positive correlation between the proportion of Taiwanese and percentage of population with a disability under the age of 5 in the United States with a correlation coefficient (R) of 0.661 and weighted average of 1.3%. Similarly, the statistical analysis conducted on geographies consisting of 209,665,961 people shows a slight negative correlation between the proportion of Immigrants from Colombia and percentage of population with a disability under the age of 5 in the United States with a correlation coefficient (R) of -0.073 and weighted average of 1.2%, a difference of 9.5%.
Taiwanese vs Immigrants from Colombia Disability Age Under 5

Disability Age Under 5 Correlation Summary

MeasurementTaiwaneseImmigrants from Colombia
Minimum0.21%0.32%
Maximum4.0%3.1%
Range3.7%2.8%
Mean1.3%1.3%
Median0.96%1.2%
Interquartile 25% (IQ1)0.53%0.86%
Interquartile 75% (IQ3)1.7%1.6%
Interquartile Range (IQR)1.1%0.78%
Standard Deviation (Sample)0.96%0.67%
Standard Deviation (Population)0.94%0.66%

Similar Demographics by Disability Age Under 5

Demographics Similar to Taiwanese by Disability Age Under 5

In terms of disability age under 5, the demographic groups most similar to Taiwanese are Luxembourger (1.3%, a difference of 0.010%), Immigrants from Costa Rica (1.3%, a difference of 0.23%), Lebanese (1.3%, a difference of 0.32%), Panamanian (1.3%, a difference of 0.34%), and Bahamian (1.3%, a difference of 0.34%).
DemographicsRating | RankDisability Age Under 5
Serbians
9.6
/100
|
#220
Tragic
1.3%
Sub-Saharan Africans
8.3
/100
|
#221
Tragic
1.3%
Ukrainians
8.3
/100
|
#222
Tragic
1.3%
Hispanics or Latinos
7.7
/100
|
#223
Tragic
1.3%
Latvians
7.1
/100
|
#224
Tragic
1.3%
Panamanians
7.1
/100
|
#225
Tragic
1.3%
Bahamians
7.1
/100
|
#226
Tragic
1.3%
Taiwanese
6.1
/100
|
#227
Tragic
1.3%
Luxembourgers
6.1
/100
|
#228
Tragic
1.3%
Immigrants | Costa Rica
5.5
/100
|
#229
Tragic
1.3%
Lebanese
5.3
/100
|
#230
Tragic
1.3%
Immigrants | Northern Europe
4.7
/100
|
#231
Tragic
1.3%
French American Indians
4.5
/100
|
#232
Tragic
1.3%
Tongans
4.2
/100
|
#233
Tragic
1.3%
Pueblo
3.8
/100
|
#234
Tragic
1.3%

Demographics Similar to Immigrants from Colombia by Disability Age Under 5

In terms of disability age under 5, the demographic groups most similar to Immigrants from Colombia are Alsatian (1.2%, a difference of 0.010%), Immigrants from Middle Africa (1.2%, a difference of 0.010%), Immigrants from Honduras (1.2%, a difference of 0.15%), Immigrants from Zimbabwe (1.2%, a difference of 0.19%), and Somali (1.2%, a difference of 0.21%).
DemographicsRating | RankDisability Age Under 5
Fijians
84.7
/100
|
#135
Excellent
1.2%
Moroccans
83.6
/100
|
#136
Excellent
1.2%
Immigrants | Eastern Africa
83.1
/100
|
#137
Excellent
1.2%
Immigrants | Czechoslovakia
82.8
/100
|
#138
Excellent
1.2%
New Zealanders
81.4
/100
|
#139
Excellent
1.2%
Somalis
80.8
/100
|
#140
Excellent
1.2%
Immigrants | Honduras
80.4
/100
|
#141
Excellent
1.2%
Immigrants | Colombia
79.3
/100
|
#142
Good
1.2%
Alsatians
79.3
/100
|
#143
Good
1.2%
Immigrants | Middle Africa
79.3
/100
|
#144
Good
1.2%
Immigrants | Zimbabwe
77.9
/100
|
#145
Good
1.2%
Samoans
77.7
/100
|
#146
Good
1.2%
Icelanders
76.3
/100
|
#147
Good
1.2%
Ghanaians
76.3
/100
|
#148
Good
1.2%
Kenyans
75.9
/100
|
#149
Good
1.2%