Taiwanese vs Uruguayan Disability Age Under 5
COMPARE
Taiwanese
Uruguayan
Disability Age Under 5
Disability Age Under 5 Comparison
Taiwanese
Uruguayans
1.3%
DISABILITY AGE UNDER 5
6.1/ 100
METRIC RATING
227th/ 347
METRIC RANK
1.2%
DISABILITY AGE UNDER 5
68.8/ 100
METRIC RATING
154th/ 347
METRIC RANK
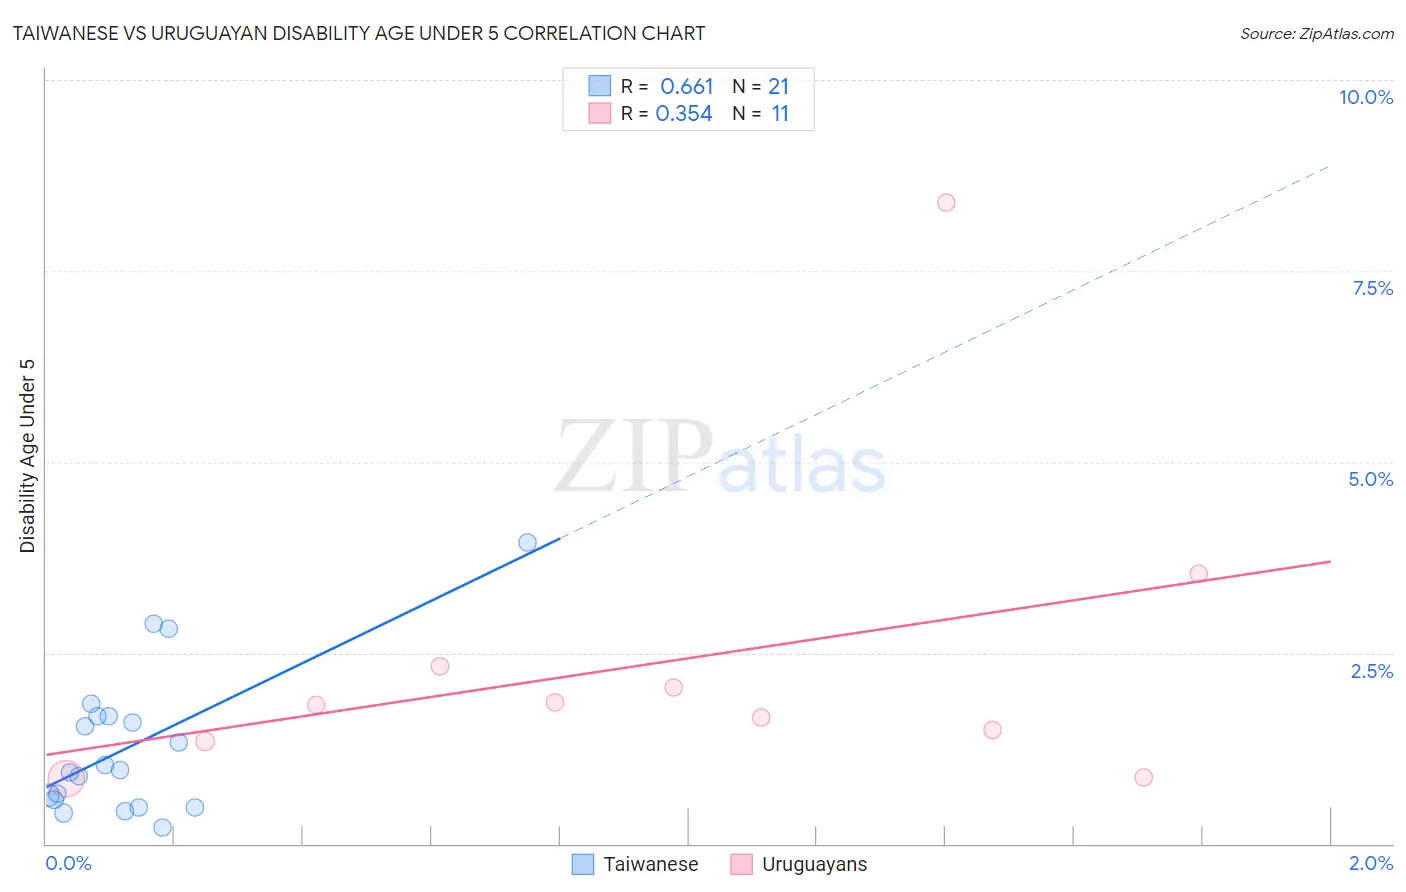
Taiwanese vs Uruguayan Disability Age Under 5 Correlation Chart
The statistical analysis conducted on geographies consisting of 29,016,682 people shows a significant positive correlation between the proportion of Taiwanese and percentage of population with a disability under the age of 5 in the United States with a correlation coefficient (R) of 0.661 and weighted average of 1.3%. Similarly, the statistical analysis conducted on geographies consisting of 100,557,895 people shows a mild positive correlation between the proportion of Uruguayans and percentage of population with a disability under the age of 5 in the United States with a correlation coefficient (R) of 0.354 and weighted average of 1.2%, a difference of 8.1%.
Disability Age Under 5 Correlation Summary
| Measurement | Taiwanese | Uruguayan |
| Minimum | 0.21% | 0.85% |
| Maximum | 4.0% | 8.4% |
| Range | 3.7% | 7.6% |
| Mean | 1.3% | 2.4% |
| Median | 0.96% | 1.8% |
| Interquartile 25% (IQ1) | 0.53% | 1.3% |
| Interquartile 75% (IQ3) | 1.7% | 2.3% |
| Interquartile Range (IQR) | 1.1% | 0.97% |
| Standard Deviation (Sample) | 0.96% | 2.1% |
| Standard Deviation (Population) | 0.94% | 2.0% |
Similar Demographics by Disability Age Under 5
Demographics Similar to Taiwanese by Disability Age Under 5
In terms of disability age under 5, the demographic groups most similar to Taiwanese are Luxembourger (1.3%, a difference of 0.010%), Immigrants from Costa Rica (1.3%, a difference of 0.23%), Lebanese (1.3%, a difference of 0.32%), Panamanian (1.3%, a difference of 0.34%), and Bahamian (1.3%, a difference of 0.34%).
| Demographics | Rating | Rank | Disability Age Under 5 |
| Serbians | 9.6 /100 | #220 | Tragic 1.3% |
| Sub-Saharan Africans | 8.3 /100 | #221 | Tragic 1.3% |
| Ukrainians | 8.3 /100 | #222 | Tragic 1.3% |
| Hispanics or Latinos | 7.7 /100 | #223 | Tragic 1.3% |
| Latvians | 7.1 /100 | #224 | Tragic 1.3% |
| Panamanians | 7.1 /100 | #225 | Tragic 1.3% |
| Bahamians | 7.1 /100 | #226 | Tragic 1.3% |
| Taiwanese | 6.1 /100 | #227 | Tragic 1.3% |
| Luxembourgers | 6.1 /100 | #228 | Tragic 1.3% |
| Immigrants | Costa Rica | 5.5 /100 | #229 | Tragic 1.3% |
| Lebanese | 5.3 /100 | #230 | Tragic 1.3% |
| Immigrants | Northern Europe | 4.7 /100 | #231 | Tragic 1.3% |
| French American Indians | 4.5 /100 | #232 | Tragic 1.3% |
| Tongans | 4.2 /100 | #233 | Tragic 1.3% |
| Pueblo | 3.8 /100 | #234 | Tragic 1.3% |
Demographics Similar to Uruguayans by Disability Age Under 5
In terms of disability age under 5, the demographic groups most similar to Uruguayans are Immigrants from Ghana (1.2%, a difference of 0.010%), Hawaiian (1.2%, a difference of 0.030%), Immigrants from Thailand (1.2%, a difference of 0.070%), Immigrants from South America (1.2%, a difference of 0.19%), and Arab (1.2%, a difference of 0.25%).
| Demographics | Rating | Rank | Disability Age Under 5 |
| Icelanders | 76.3 /100 | #147 | Good 1.2% |
| Ghanaians | 76.3 /100 | #148 | Good 1.2% |
| Kenyans | 75.9 /100 | #149 | Good 1.2% |
| South Americans | 75.6 /100 | #150 | Good 1.2% |
| Yaqui | 74.8 /100 | #151 | Good 1.2% |
| Hondurans | 72.5 /100 | #152 | Good 1.2% |
| Immigrants | Thailand | 69.4 /100 | #153 | Good 1.2% |
| Uruguayans | 68.8 /100 | #154 | Good 1.2% |
| Immigrants | Ghana | 68.7 /100 | #155 | Good 1.2% |
| Hawaiians | 68.5 /100 | #156 | Good 1.2% |
| Immigrants | South America | 67.0 /100 | #157 | Good 1.2% |
| Arabs | 66.4 /100 | #158 | Good 1.2% |
| Colombians | 65.8 /100 | #159 | Good 1.2% |
| Immigrants | Latin America | 65.8 /100 | #160 | Good 1.2% |
| Immigrants | Africa | 65.1 /100 | #161 | Good 1.2% |