Taiwanese vs Immigrants from Lithuania 11th Grade
COMPARE
Taiwanese
Immigrants from Lithuania
11th Grade
11th Grade Comparison
Taiwanese
Immigrants from Lithuania
91.3%
11TH GRADE
0.6/ 100
METRIC RATING
261st/ 347
METRIC RANK
94.1%
11TH GRADE
99.9/ 100
METRIC RATING
39th/ 347
METRIC RANK
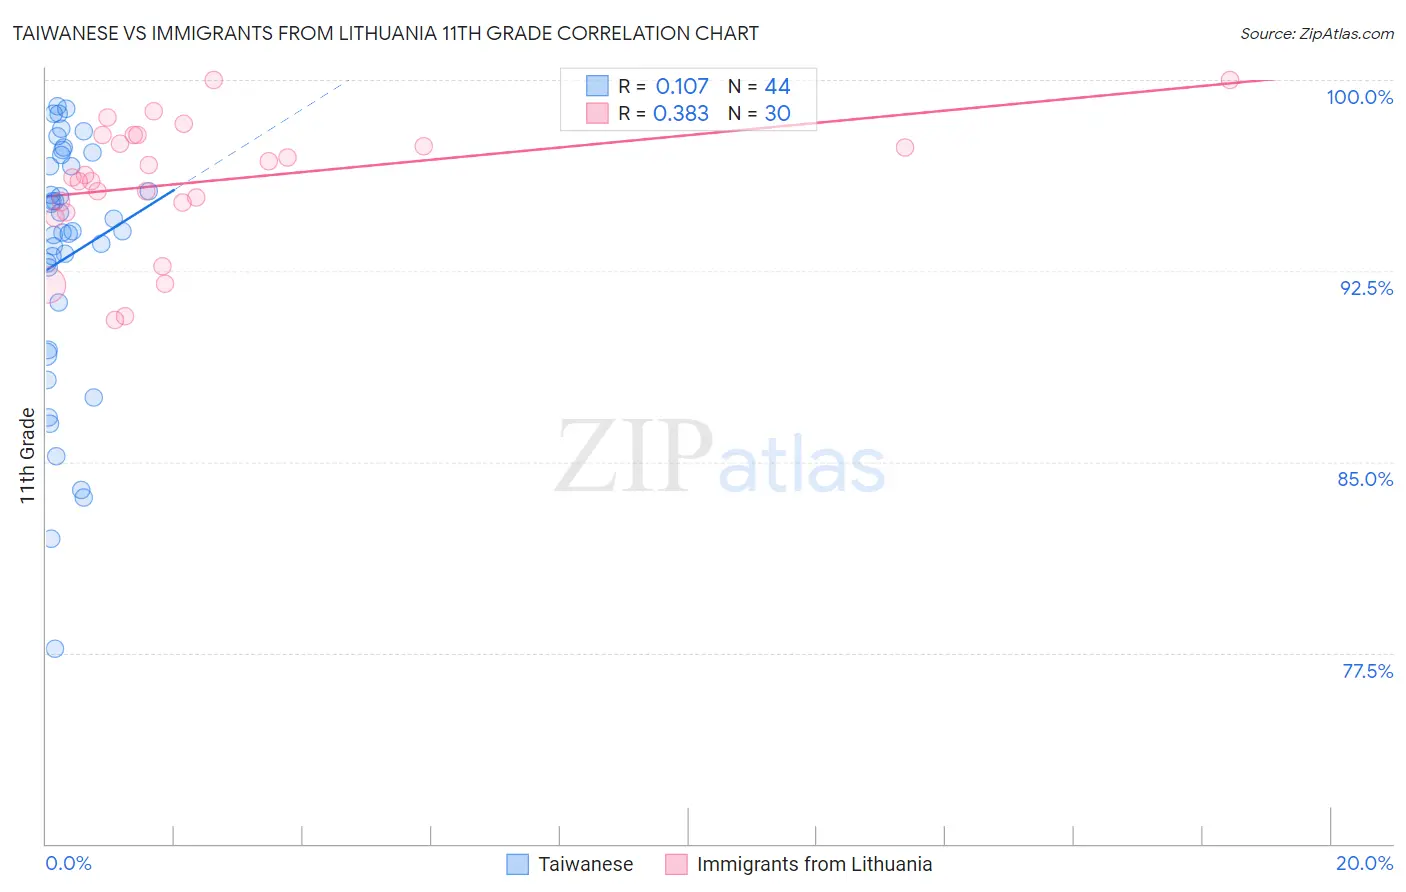
Taiwanese vs Immigrants from Lithuania 11th Grade Correlation Chart
The statistical analysis conducted on geographies consisting of 31,724,936 people shows a poor positive correlation between the proportion of Taiwanese and percentage of population with at least 11th grade education in the United States with a correlation coefficient (R) of 0.107 and weighted average of 91.3%. Similarly, the statistical analysis conducted on geographies consisting of 117,724,932 people shows a mild positive correlation between the proportion of Immigrants from Lithuania and percentage of population with at least 11th grade education in the United States with a correlation coefficient (R) of 0.383 and weighted average of 94.1%, a difference of 3.0%.
11th Grade Correlation Summary
| Measurement | Taiwanese | Immigrants from Lithuania |
| Minimum | 77.7% | 90.6% |
| Maximum | 98.9% | 100.0% |
| Range | 21.3% | 9.4% |
| Mean | 93.0% | 96.0% |
| Median | 94.0% | 96.2% |
| Interquartile 25% (IQ1) | 90.3% | 95.2% |
| Interquartile 75% (IQ3) | 96.8% | 97.8% |
| Interquartile Range (IQR) | 6.5% | 2.6% |
| Standard Deviation (Sample) | 5.1% | 2.5% |
| Standard Deviation (Population) | 5.0% | 2.4% |
Similar Demographics by 11th Grade
Demographics Similar to Taiwanese by 11th Grade
In terms of 11th grade, the demographic groups most similar to Taiwanese are Jamaican (91.4%, a difference of 0.010%), Spanish American (91.4%, a difference of 0.010%), Immigrants from Uruguay (91.3%, a difference of 0.010%), Immigrants from Colombia (91.4%, a difference of 0.030%), and Immigrants from Senegal (91.4%, a difference of 0.050%).
| Demographics | Rating | Rank | 11th Grade |
| Immigrants | Eritrea | 0.7 /100 | #254 | Tragic 91.4% |
| Blacks/African Americans | 0.7 /100 | #255 | Tragic 91.4% |
| Immigrants | Senegal | 0.7 /100 | #256 | Tragic 91.4% |
| Cajuns | 0.7 /100 | #257 | Tragic 91.4% |
| Immigrants | Colombia | 0.6 /100 | #258 | Tragic 91.4% |
| Jamaicans | 0.6 /100 | #259 | Tragic 91.4% |
| Spanish Americans | 0.6 /100 | #260 | Tragic 91.4% |
| Taiwanese | 0.6 /100 | #261 | Tragic 91.3% |
| Immigrants | Uruguay | 0.5 /100 | #262 | Tragic 91.3% |
| Immigrants | Ghana | 0.3 /100 | #263 | Tragic 91.2% |
| Yup'ik | 0.3 /100 | #264 | Tragic 91.2% |
| Pueblo | 0.3 /100 | #265 | Tragic 91.2% |
| Immigrants | Western Africa | 0.3 /100 | #266 | Tragic 91.2% |
| Immigrants | Jamaica | 0.3 /100 | #267 | Tragic 91.2% |
| U.S. Virgin Islanders | 0.2 /100 | #268 | Tragic 91.1% |
Demographics Similar to Immigrants from Lithuania by 11th Grade
In terms of 11th grade, the demographic groups most similar to Immigrants from Lithuania are Thai (94.1%, a difference of 0.0%), Cypriot (94.1%, a difference of 0.010%), Immigrants from Austria (94.1%, a difference of 0.020%), Greek (94.1%, a difference of 0.020%), and Immigrants from Ireland (94.1%, a difference of 0.030%).
| Demographics | Rating | Rank | 11th Grade |
| Belgians | 99.9 /100 | #32 | Exceptional 94.2% |
| British | 99.9 /100 | #33 | Exceptional 94.2% |
| Immigrants | Scotland | 99.9 /100 | #34 | Exceptional 94.2% |
| Immigrants | Singapore | 99.9 /100 | #35 | Exceptional 94.2% |
| Immigrants | Northern Europe | 99.9 /100 | #36 | Exceptional 94.2% |
| Northern Europeans | 99.9 /100 | #37 | Exceptional 94.2% |
| Hungarians | 99.9 /100 | #38 | Exceptional 94.2% |
| Immigrants | Lithuania | 99.9 /100 | #39 | Exceptional 94.1% |
| Thais | 99.9 /100 | #40 | Exceptional 94.1% |
| Cypriots | 99.9 /100 | #41 | Exceptional 94.1% |
| Immigrants | Austria | 99.9 /100 | #42 | Exceptional 94.1% |
| Greeks | 99.9 /100 | #43 | Exceptional 94.1% |
| Immigrants | Ireland | 99.9 /100 | #44 | Exceptional 94.1% |
| Australians | 99.9 /100 | #45 | Exceptional 94.1% |
| Serbians | 99.9 /100 | #46 | Exceptional 94.1% |