Taiwanese vs Slavic Disability Age Under 5
COMPARE
Taiwanese
Slavic
Disability Age Under 5
Disability Age Under 5 Comparison
Taiwanese
Slavs
1.3%
DISABILITY AGE UNDER 5
6.1/ 100
METRIC RATING
227th/ 347
METRIC RANK
1.4%
DISABILITY AGE UNDER 5
0.3/ 100
METRIC RATING
260th/ 347
METRIC RANK
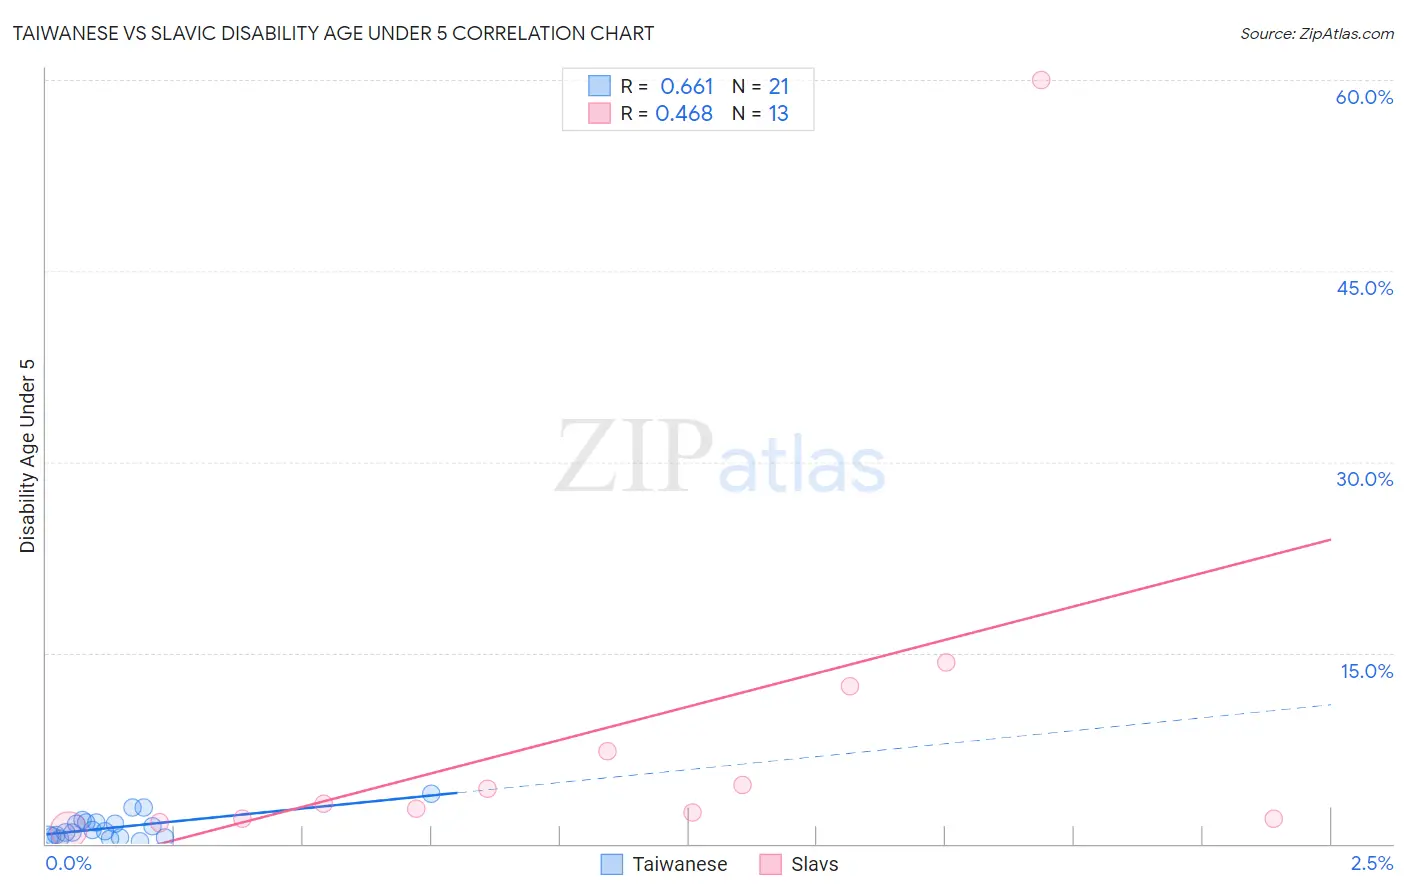
Taiwanese vs Slavic Disability Age Under 5 Correlation Chart
The statistical analysis conducted on geographies consisting of 29,016,682 people shows a significant positive correlation between the proportion of Taiwanese and percentage of population with a disability under the age of 5 in the United States with a correlation coefficient (R) of 0.661 and weighted average of 1.3%. Similarly, the statistical analysis conducted on geographies consisting of 161,605,234 people shows a moderate positive correlation between the proportion of Slavs and percentage of population with a disability under the age of 5 in the United States with a correlation coefficient (R) of 0.468 and weighted average of 1.4%, a difference of 6.9%.
Disability Age Under 5 Correlation Summary
| Measurement | Taiwanese | Slavic |
| Minimum | 0.21% | 1.0% |
| Maximum | 4.0% | 60.0% |
| Range | 3.7% | 59.0% |
| Mean | 1.3% | 9.1% |
| Median | 0.96% | 3.1% |
| Interquartile 25% (IQ1) | 0.53% | 2.0% |
| Interquartile 75% (IQ3) | 1.7% | 9.8% |
| Interquartile Range (IQR) | 1.1% | 7.8% |
| Standard Deviation (Sample) | 0.96% | 15.9% |
| Standard Deviation (Population) | 0.94% | 15.2% |
Similar Demographics by Disability Age Under 5
Demographics Similar to Taiwanese by Disability Age Under 5
In terms of disability age under 5, the demographic groups most similar to Taiwanese are Luxembourger (1.3%, a difference of 0.010%), Immigrants from Costa Rica (1.3%, a difference of 0.23%), Lebanese (1.3%, a difference of 0.32%), Panamanian (1.3%, a difference of 0.34%), and Bahamian (1.3%, a difference of 0.34%).
| Demographics | Rating | Rank | Disability Age Under 5 |
| Serbians | 9.6 /100 | #220 | Tragic 1.3% |
| Sub-Saharan Africans | 8.3 /100 | #221 | Tragic 1.3% |
| Ukrainians | 8.3 /100 | #222 | Tragic 1.3% |
| Hispanics or Latinos | 7.7 /100 | #223 | Tragic 1.3% |
| Latvians | 7.1 /100 | #224 | Tragic 1.3% |
| Panamanians | 7.1 /100 | #225 | Tragic 1.3% |
| Bahamians | 7.1 /100 | #226 | Tragic 1.3% |
| Taiwanese | 6.1 /100 | #227 | Tragic 1.3% |
| Luxembourgers | 6.1 /100 | #228 | Tragic 1.3% |
| Immigrants | Costa Rica | 5.5 /100 | #229 | Tragic 1.3% |
| Lebanese | 5.3 /100 | #230 | Tragic 1.3% |
| Immigrants | Northern Europe | 4.7 /100 | #231 | Tragic 1.3% |
| French American Indians | 4.5 /100 | #232 | Tragic 1.3% |
| Tongans | 4.2 /100 | #233 | Tragic 1.3% |
| Pueblo | 3.8 /100 | #234 | Tragic 1.3% |
Demographics Similar to Slavs by Disability Age Under 5
In terms of disability age under 5, the demographic groups most similar to Slavs are Immigrants from Southern Europe (1.4%, a difference of 0.21%), Costa Rican (1.4%, a difference of 0.37%), Slovene (1.4%, a difference of 0.55%), Immigrants from Netherlands (1.4%, a difference of 0.67%), and Immigrants from Dominica (1.4%, a difference of 0.83%).
| Demographics | Rating | Rank | Disability Age Under 5 |
| Australians | 0.7 /100 | #253 | Tragic 1.4% |
| Immigrants | Brazil | 0.7 /100 | #254 | Tragic 1.4% |
| Immigrants | Liberia | 0.6 /100 | #255 | Tragic 1.4% |
| Immigrants | Western Europe | 0.5 /100 | #256 | Tragic 1.4% |
| Slovenes | 0.3 /100 | #257 | Tragic 1.4% |
| Costa Ricans | 0.3 /100 | #258 | Tragic 1.4% |
| Immigrants | Southern Europe | 0.3 /100 | #259 | Tragic 1.4% |
| Slavs | 0.3 /100 | #260 | Tragic 1.4% |
| Immigrants | Netherlands | 0.2 /100 | #261 | Tragic 1.4% |
| Immigrants | Dominica | 0.2 /100 | #262 | Tragic 1.4% |
| Spanish | 0.2 /100 | #263 | Tragic 1.4% |
| Yugoslavians | 0.1 /100 | #264 | Tragic 1.4% |
| Carpatho Rusyns | 0.1 /100 | #265 | Tragic 1.4% |
| Immigrants | Germany | 0.1 /100 | #266 | Tragic 1.4% |
| Cree | 0.1 /100 | #267 | Tragic 1.4% |