Syrian vs Immigrants from Fiji Child Poverty Among Girls Under 16
COMPARE
Syrian
Immigrants from Fiji
Child Poverty Among Girls Under 16
Child Poverty Among Girls Under 16 Comparison
Syrians
Immigrants from Fiji
15.9%
CHILD POVERTY AMONG GIRLS UNDER 16
76.7/ 100
METRIC RATING
155th/ 347
METRIC RANK
15.9%
CHILD POVERTY AMONG GIRLS UNDER 16
76.1/ 100
METRIC RATING
156th/ 347
METRIC RANK
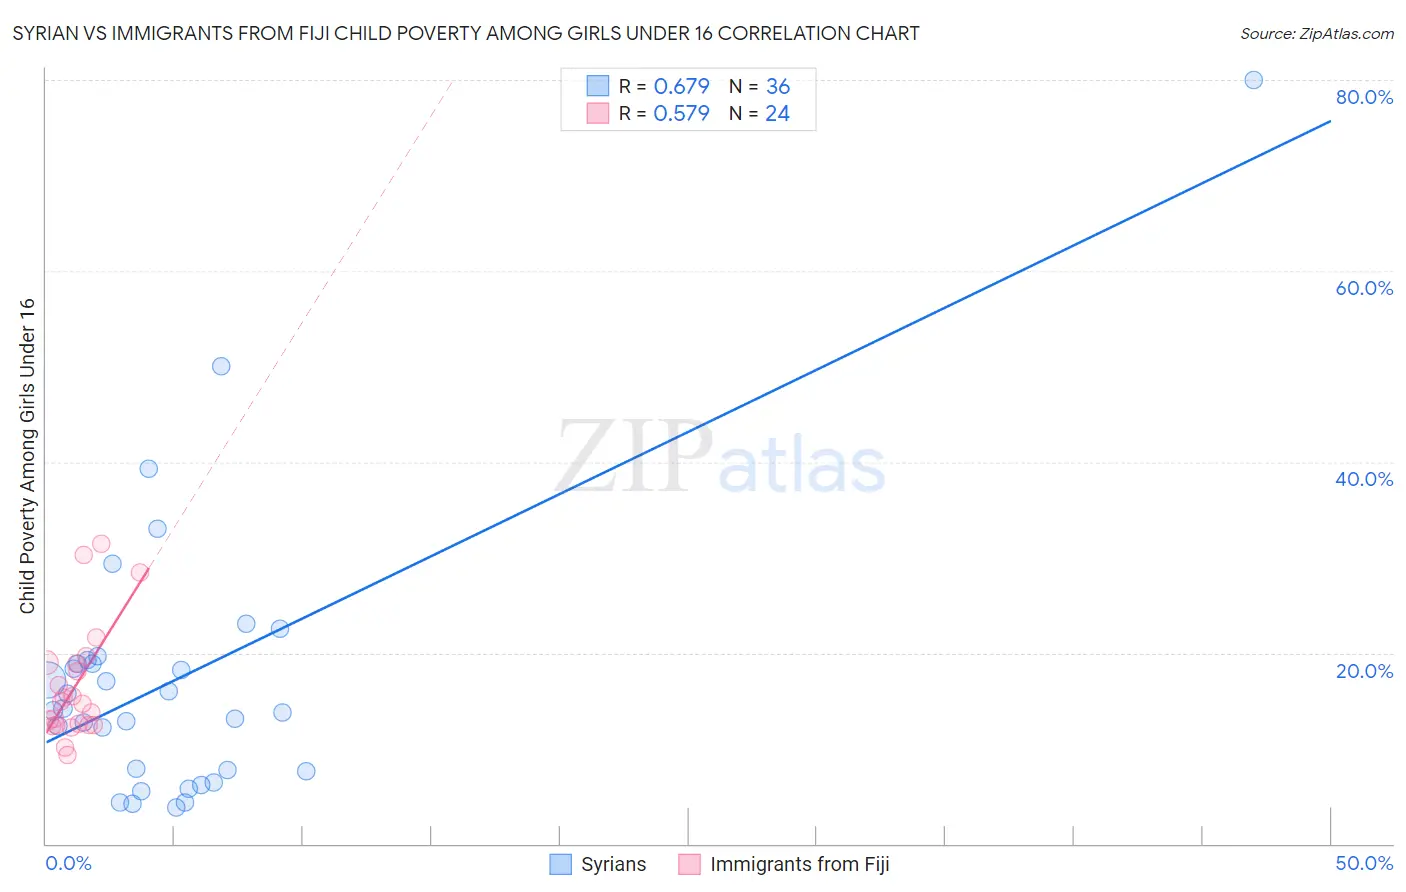
Syrian vs Immigrants from Fiji Child Poverty Among Girls Under 16 Correlation Chart
The statistical analysis conducted on geographies consisting of 262,279,372 people shows a significant positive correlation between the proportion of Syrians and poverty level among girls under the age of 16 in the United States with a correlation coefficient (R) of 0.679 and weighted average of 15.9%. Similarly, the statistical analysis conducted on geographies consisting of 93,514,915 people shows a substantial positive correlation between the proportion of Immigrants from Fiji and poverty level among girls under the age of 16 in the United States with a correlation coefficient (R) of 0.579 and weighted average of 15.9%, a difference of 0.10%.
Child Poverty Among Girls Under 16 Correlation Summary
| Measurement | Syrian | Immigrants from Fiji |
| Minimum | 3.7% | 9.3% |
| Maximum | 80.0% | 31.5% |
| Range | 76.2% | 22.2% |
| Mean | 17.4% | 16.6% |
| Median | 14.0% | 14.8% |
| Interquartile 25% (IQ1) | 7.7% | 12.5% |
| Interquartile 75% (IQ3) | 19.0% | 18.9% |
| Interquartile Range (IQR) | 11.4% | 6.4% |
| Standard Deviation (Sample) | 14.7% | 6.0% |
| Standard Deviation (Population) | 14.5% | 5.9% |
Demographics Similar to Syrians and Immigrants from Fiji by Child Poverty Among Girls Under 16
In terms of child poverty among girls under 16, the demographic groups most similar to Syrians are Immigrants from Chile (15.9%, a difference of 0.010%), Colombian (15.9%, a difference of 0.10%), Guamanian/Chamorro (15.9%, a difference of 0.22%), Slovak (15.9%, a difference of 0.23%), and Immigrants from Nepal (15.9%, a difference of 0.32%). Similarly, the demographic groups most similar to Immigrants from Fiji are Colombian (15.9%, a difference of 0.0%), Immigrants from Chile (15.9%, a difference of 0.11%), Guamanian/Chamorro (15.9%, a difference of 0.12%), Slovak (15.9%, a difference of 0.13%), and Immigrants from Nepal (15.9%, a difference of 0.42%).
| Demographics | Rating | Rank | Child Poverty Among Girls Under 16 |
| Welsh | 85.4 /100 | #145 | Excellent 15.6% |
| Samoans | 84.2 /100 | #146 | Excellent 15.7% |
| Slavs | 83.1 /100 | #147 | Excellent 15.7% |
| Icelanders | 82.4 /100 | #148 | Excellent 15.7% |
| Immigrants | Hungary | 80.9 /100 | #149 | Excellent 15.8% |
| Immigrants | Albania | 80.7 /100 | #150 | Excellent 15.8% |
| Venezuelans | 80.1 /100 | #151 | Excellent 15.8% |
| Immigrants | Kuwait | 79.4 /100 | #152 | Good 15.8% |
| Immigrants | Nepal | 78.5 /100 | #153 | Good 15.9% |
| Immigrants | Chile | 76.7 /100 | #154 | Good 15.9% |
| Syrians | 76.7 /100 | #155 | Good 15.9% |
| Immigrants | Fiji | 76.1 /100 | #156 | Good 15.9% |
| Colombians | 76.1 /100 | #157 | Good 15.9% |
| Guamanians/Chamorros | 75.3 /100 | #158 | Good 15.9% |
| Slovaks | 75.2 /100 | #159 | Good 15.9% |
| French | 72.8 /100 | #160 | Good 16.0% |
| Immigrants | Northern Africa | 72.0 /100 | #161 | Good 16.0% |
| French Canadians | 68.7 /100 | #162 | Good 16.1% |
| Immigrants | Oceania | 68.4 /100 | #163 | Good 16.1% |
| Immigrants | Colombia | 67.8 /100 | #164 | Good 16.1% |
| Immigrants | Germany | 67.3 /100 | #165 | Good 16.1% |