Soviet Union vs Immigrants from Fiji Female Disability
COMPARE
Soviet Union
Immigrants from Fiji
Female Disability
Female Disability Comparison
Soviet Union
Immigrants from Fiji
11.7%
FEMALE DISABILITY
98.1/ 100
METRIC RATING
110th/ 347
METRIC RANK
12.3%
FEMALE DISABILITY
38.2/ 100
METRIC RATING
179th/ 347
METRIC RANK
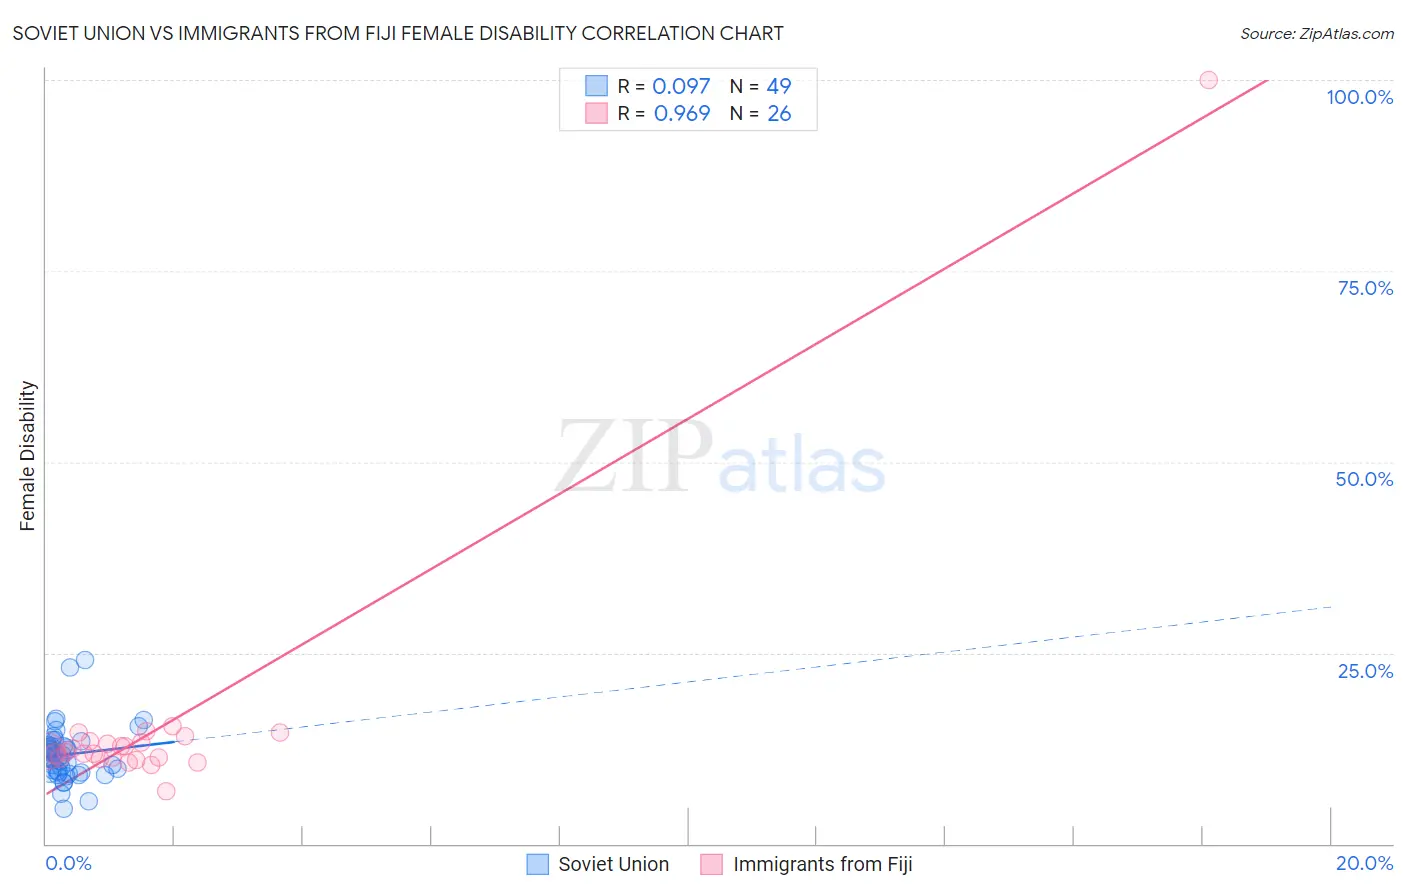
Soviet Union vs Immigrants from Fiji Female Disability Correlation Chart
The statistical analysis conducted on geographies consisting of 43,504,651 people shows a slight positive correlation between the proportion of Soviet Union and percentage of females with a disability in the United States with a correlation coefficient (R) of 0.097 and weighted average of 11.7%. Similarly, the statistical analysis conducted on geographies consisting of 93,754,243 people shows a perfect positive correlation between the proportion of Immigrants from Fiji and percentage of females with a disability in the United States with a correlation coefficient (R) of 0.969 and weighted average of 12.3%, a difference of 4.3%.
Female Disability Correlation Summary
| Measurement | Soviet Union | Immigrants from Fiji |
| Minimum | 4.6% | 6.9% |
| Maximum | 24.1% | 100.0% |
| Range | 19.5% | 93.1% |
| Mean | 11.7% | 15.6% |
| Median | 11.3% | 12.0% |
| Interquartile 25% (IQ1) | 9.3% | 11.2% |
| Interquartile 75% (IQ3) | 12.9% | 13.4% |
| Interquartile Range (IQR) | 3.5% | 2.2% |
| Standard Deviation (Sample) | 3.5% | 17.3% |
| Standard Deviation (Population) | 3.5% | 17.0% |
Similar Demographics by Female Disability
Demographics Similar to Soviet Union by Female Disability
In terms of female disability, the demographic groups most similar to Soviet Union are Immigrants (11.7%, a difference of 0.0%), Costa Rican (11.7%, a difference of 0.020%), New Zealander (11.7%, a difference of 0.030%), Latvian (11.7%, a difference of 0.050%), and Immigrants from Greece (11.7%, a difference of 0.080%).
| Demographics | Rating | Rank | Female Disability |
| Immigrants | Eastern Africa | 98.3 /100 | #103 | Exceptional 11.7% |
| Immigrants | Western Asia | 98.3 /100 | #104 | Exceptional 11.7% |
| Australians | 98.3 /100 | #105 | Exceptional 11.7% |
| Immigrants | Greece | 98.2 /100 | #106 | Exceptional 11.7% |
| Latvians | 98.2 /100 | #107 | Exceptional 11.7% |
| New Zealanders | 98.1 /100 | #108 | Exceptional 11.7% |
| Immigrants | Immigrants | 98.1 /100 | #109 | Exceptional 11.7% |
| Soviet Union | 98.1 /100 | #110 | Exceptional 11.7% |
| Costa Ricans | 98.1 /100 | #111 | Exceptional 11.7% |
| Immigrants | Bangladesh | 97.8 /100 | #112 | Exceptional 11.8% |
| Immigrants | Belarus | 97.8 /100 | #113 | Exceptional 11.8% |
| South Africans | 97.7 /100 | #114 | Exceptional 11.8% |
| Brazilians | 97.7 /100 | #115 | Exceptional 11.8% |
| Immigrants | Morocco | 97.6 /100 | #116 | Exceptional 11.8% |
| Immigrants | Eastern Europe | 97.2 /100 | #117 | Exceptional 11.8% |
Demographics Similar to Immigrants from Fiji by Female Disability
In terms of female disability, the demographic groups most similar to Immigrants from Fiji are Albanian (12.3%, a difference of 0.010%), Immigrants from Canada (12.3%, a difference of 0.040%), Norwegian (12.3%, a difference of 0.050%), Cuban (12.3%, a difference of 0.070%), and Iraqi (12.3%, a difference of 0.090%).
| Demographics | Rating | Rank | Female Disability |
| Haitians | 51.9 /100 | #172 | Average 12.2% |
| Immigrants | Mexico | 50.8 /100 | #173 | Average 12.2% |
| Immigrants | England | 50.0 /100 | #174 | Average 12.2% |
| Immigrants | St. Vincent and the Grenadines | 49.7 /100 | #175 | Average 12.2% |
| Immigrants | Guyana | 43.1 /100 | #176 | Average 12.2% |
| Immigrants | Ghana | 42.5 /100 | #177 | Average 12.2% |
| Immigrants | Western Europe | 40.9 /100 | #178 | Average 12.2% |
| Immigrants | Fiji | 38.2 /100 | #179 | Fair 12.3% |
| Albanians | 37.9 /100 | #180 | Fair 12.3% |
| Immigrants | Canada | 37.2 /100 | #181 | Fair 12.3% |
| Norwegians | 36.9 /100 | #182 | Fair 12.3% |
| Cubans | 36.5 /100 | #183 | Fair 12.3% |
| Iraqis | 36.0 /100 | #184 | Fair 12.3% |
| Immigrants | Uzbekistan | 33.9 /100 | #185 | Fair 12.3% |
| Austrians | 33.3 /100 | #186 | Fair 12.3% |