Bermudan vs Immigrants from Fiji Female Disability
COMPARE
Bermudan
Immigrants from Fiji
Female Disability
Female Disability Comparison
Bermudans
Immigrants from Fiji
12.7%
FEMALE DISABILITY
1.0/ 100
METRIC RATING
261st/ 347
METRIC RANK
12.3%
FEMALE DISABILITY
38.2/ 100
METRIC RATING
179th/ 347
METRIC RANK
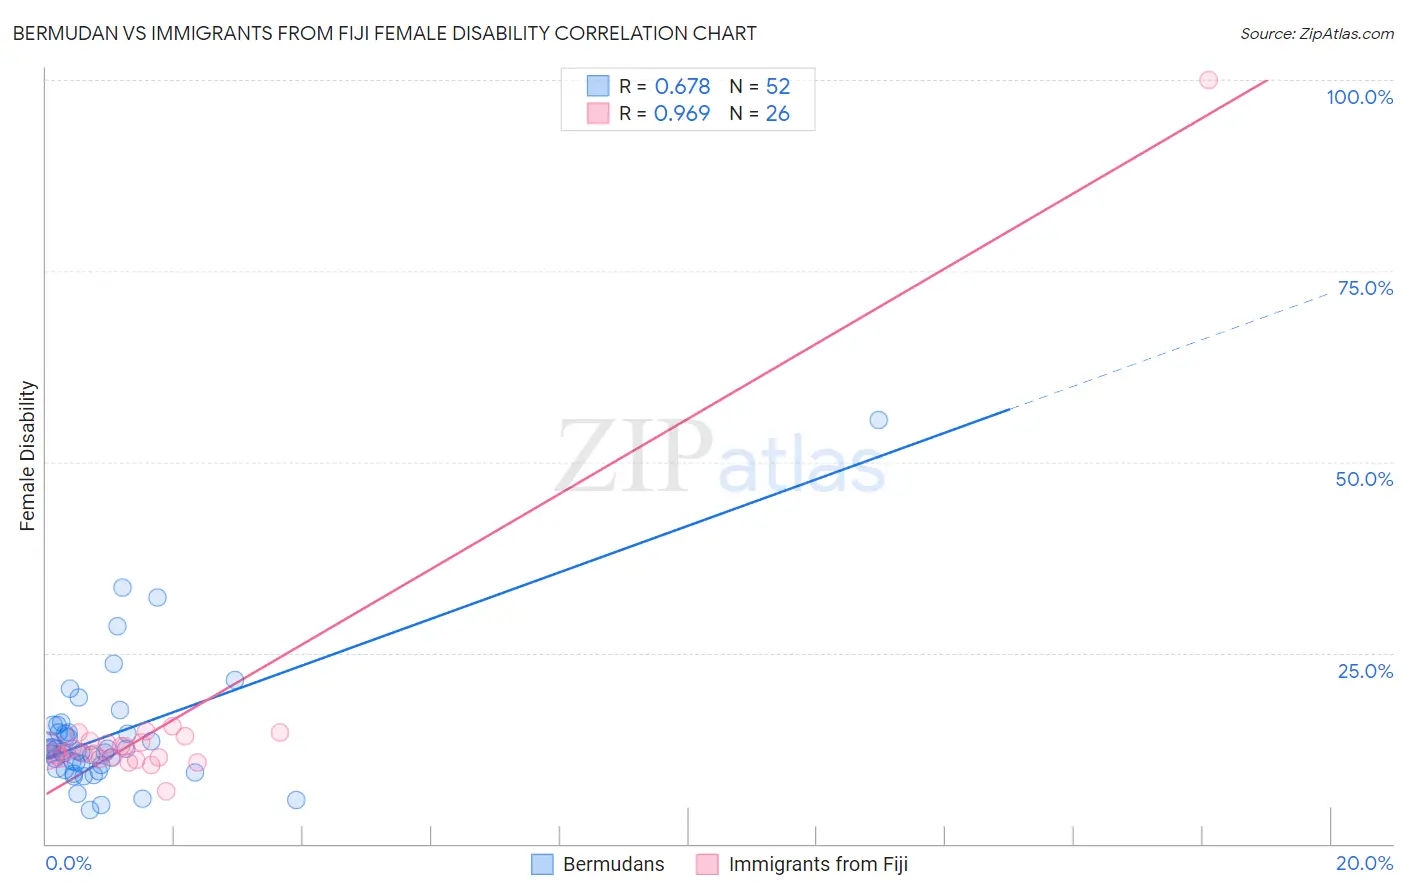
Bermudan vs Immigrants from Fiji Female Disability Correlation Chart
The statistical analysis conducted on geographies consisting of 55,721,549 people shows a significant positive correlation between the proportion of Bermudans and percentage of females with a disability in the United States with a correlation coefficient (R) of 0.678 and weighted average of 12.7%. Similarly, the statistical analysis conducted on geographies consisting of 93,754,243 people shows a perfect positive correlation between the proportion of Immigrants from Fiji and percentage of females with a disability in the United States with a correlation coefficient (R) of 0.969 and weighted average of 12.3%, a difference of 3.9%.
Female Disability Correlation Summary
| Measurement | Bermudan | Immigrants from Fiji |
| Minimum | 4.4% | 6.9% |
| Maximum | 55.4% | 100.0% |
| Range | 51.1% | 93.1% |
| Mean | 14.1% | 15.6% |
| Median | 12.2% | 12.0% |
| Interquartile 25% (IQ1) | 10.1% | 11.2% |
| Interquartile 75% (IQ3) | 14.5% | 13.4% |
| Interquartile Range (IQR) | 4.5% | 2.2% |
| Standard Deviation (Sample) | 8.3% | 17.3% |
| Standard Deviation (Population) | 8.2% | 17.0% |
Similar Demographics by Female Disability
Demographics Similar to Bermudans by Female Disability
In terms of female disability, the demographic groups most similar to Bermudans are Subsaharan African (12.7%, a difference of 0.040%), Immigrants from Armenia (12.7%, a difference of 0.050%), Czechoslovakian (12.7%, a difference of 0.070%), Liberian (12.7%, a difference of 0.14%), and Aleut (12.7%, a difference of 0.14%).
| Demographics | Rating | Rank | Female Disability |
| Hawaiians | 1.4 /100 | #254 | Tragic 12.7% |
| Immigrants | Germany | 1.3 /100 | #255 | Tragic 12.7% |
| British West Indians | 1.2 /100 | #256 | Tragic 12.7% |
| Liberians | 1.1 /100 | #257 | Tragic 12.7% |
| Aleuts | 1.1 /100 | #258 | Tragic 12.7% |
| Immigrants | Armenia | 1.0 /100 | #259 | Tragic 12.7% |
| Sub-Saharan Africans | 1.0 /100 | #260 | Tragic 12.7% |
| Bermudans | 1.0 /100 | #261 | Tragic 12.7% |
| Czechoslovakians | 0.9 /100 | #262 | Tragic 12.7% |
| Spaniards | 0.7 /100 | #263 | Tragic 12.8% |
| Alaska Natives | 0.6 /100 | #264 | Tragic 12.8% |
| West Indians | 0.5 /100 | #265 | Tragic 12.8% |
| Finns | 0.4 /100 | #266 | Tragic 12.8% |
| Senegalese | 0.4 /100 | #267 | Tragic 12.8% |
| Immigrants | Laos | 0.4 /100 | #268 | Tragic 12.8% |
Demographics Similar to Immigrants from Fiji by Female Disability
In terms of female disability, the demographic groups most similar to Immigrants from Fiji are Albanian (12.3%, a difference of 0.010%), Immigrants from Canada (12.3%, a difference of 0.040%), Norwegian (12.3%, a difference of 0.050%), Cuban (12.3%, a difference of 0.070%), and Iraqi (12.3%, a difference of 0.090%).
| Demographics | Rating | Rank | Female Disability |
| Haitians | 51.9 /100 | #172 | Average 12.2% |
| Immigrants | Mexico | 50.8 /100 | #173 | Average 12.2% |
| Immigrants | England | 50.0 /100 | #174 | Average 12.2% |
| Immigrants | St. Vincent and the Grenadines | 49.7 /100 | #175 | Average 12.2% |
| Immigrants | Guyana | 43.1 /100 | #176 | Average 12.2% |
| Immigrants | Ghana | 42.5 /100 | #177 | Average 12.2% |
| Immigrants | Western Europe | 40.9 /100 | #178 | Average 12.2% |
| Immigrants | Fiji | 38.2 /100 | #179 | Fair 12.3% |
| Albanians | 37.9 /100 | #180 | Fair 12.3% |
| Immigrants | Canada | 37.2 /100 | #181 | Fair 12.3% |
| Norwegians | 36.9 /100 | #182 | Fair 12.3% |
| Cubans | 36.5 /100 | #183 | Fair 12.3% |
| Iraqis | 36.0 /100 | #184 | Fair 12.3% |
| Immigrants | Uzbekistan | 33.9 /100 | #185 | Fair 12.3% |
| Austrians | 33.3 /100 | #186 | Fair 12.3% |